B2B vs B2C ecommerce: when one seller serves both
A coffee supplier can sell a weekend treat and a workplace staple from the same catalog. Our analysis of European enterprise estimates asks how much customer overlap those familiar labels can hide, and what that means for a campaign brief.
Influence IQ analysis of Eurostat’s 2025 enterprise survey, covering web sales in 2024. The comparison includes 20 countries and the survey’s covered industries and enterprise size frame of 10 or more persons employed. The overlap figures are calculations from published estimates.
Abstract
B2B ecommerce means selling to businesses; B2C means selling to individual consumers. A seller can serve both. In our analysis of Eurostat’s 2025 survey, the published estimates for 20 eligible countries imply a minimum overlap of approximately 38.4% to 66.9% among web-selling enterprises. The measured organizational group combines business and public-sector customers. These are minimum overlaps compatible with the estimates, rather than direct counts of firms serving both groups. [1] [2]
All 20 countries remain above a 25% overlap threshold after the same deliberately unfavorable adjustment to the three inputs. The data concern 2024 sales and the survey’s covered enterprises with 10 or more persons employed. For marketing teams, the useful question is which buying task a campaign serves. The examples and brief below show how to distinguish those tasks without assuming that each audience needs a separate website. [3]
Imagine a coffee supplier preparing a campaign for its newest blend. One customer wants a bag for slow mornings at home. Another handles workplace supplies and wants to avoid running out before the next delivery. The beans could be identical. The information each person needs before ordering may be different.
This is a fictional example, but it exposes a practical gap in a brief that says only “our audience is B2C” or “we sell to businesses.” A product photograph can be relevant to both people while the message, evidence and promised next step serve only one of them. Even the same person could buy for home on one occasion and for work on another.
We examined customer-group estimates from Eurostat to put that planning question in context. The analysis concerns who buys through websites, apps and marketplaces. It does not decide which sales route a company should use. Its value for a business or its agency is a reason to make the buyer’s purpose explicit before choosing the campaign message.
One assortment, different reasons to order

Consumer and organizational customers can belong to the same seller
The published estimates imply substantial overlap in every country that passed our checks. Each of the 20 countries has a calculated minimum above 25%, including after the sensitivity adjustment. That consistency is the main result. A country’s position in the chart is not a recommendation about where to advertise.
Here, overlap means a seller appears in both customer groups. It does not mean that the same person is counted twice, or that a business and a consumer have the same needs. The survey measures enterprises with sales to each group. That is why the result belongs in a discussion about a seller’s customer mix, rather than a claim about the number or identity of individual buyers.
Eurostat distinguishes the number of enterprises with positive sales to each customer group from the amount of revenue those sales produce. A company with a small organizational order and substantial consumer sales can appear in both customer counts. These figures therefore cannot tell a marketer how to divide a budget between the two groups. [1]
The study also keeps business and public-sector customers together because that is how the published indicator is defined. Calling the result a pure B2B benchmark would remove part of the measured group. For a campaign brief, “organizational buyer” is a useful starting description; the business still needs to identify the actual people and purchasing situation.
All 20 countries retain an implied overlap above 25%
Minimum consumer and business/public-sector customer overlap compatible with Eurostat’s published estimates. Percent of web-selling enterprises; 2024 sales, surveyed in 2025.
| Country | Implied minimum overlap | After the 0.5-point adjustment |
|---|---|---|
| Austria | 43.5% | 37.3% |
| Bulgaria | 49.3% | 38.1% |
| Croatia | 61.6% | 52.0% |
| Cyprus | 38.4% | 31.3% |
| Czechia | 66.9% | 58.8% |
| Denmark | 45.0% | 39.4% |
| Finland | 51.4% | 45.4% |
| Germany | 51.6% | 43.0% |
| Greece | 47.9% | 40.9% |
| Hungary | 58.5% | 49.4% |
| Ireland | 42.0% | 36.7% |
| Latvia | 56.5% | 46.8% |
| Lithuania | 50.0% | 45.9% |
| Luxembourg | 47.8% | 34.7% |
| Malta | 46.4% | 41.2% |
| Netherlands | 48.5% | 41.6% |
| Portugal | 49.9% | 39.8% |
| Slovakia | 44.8% | 33.9% |
| Slovenia | 39.0% | 32.2% |
| Sweden | 57.2% | 51.6% |
How the Netherlands calculation works
The Netherlands provides a concrete example. In the 2025 survey, the estimated share of covered enterprises with web sales in 2024 was 24.66%. The corresponding shares with consumer web sales and business/public-sector web sales were 17.89% and 18.73%. All three use the same all-enterprise denominator. [2]
Adding the two customer-group shares gives 36.62 percentage points. That exceeds the web-seller estimate by 11.96 points. If the published estimates are treated as the margins of one customer mix, the two customer groups must overlap by at least that much. Otherwise they would require more web sellers than the total estimate allows.
To express the overlap within web-selling enterprises, divide the 11.96-point excess by 24.66 and multiply by 100. The result is approximately 48.5%. This is the minimum compatible with the published inputs. It is not an observed cross-tabulation, and survey error or national estimation methods can affect those inputs.
Our sensitivity check lowers each customer-group input by 0.5 percentage points and raises the web-seller input by 0.5 points. For the Netherlands, that means 17.39%, 18.23% and 25.16%. The implied minimum becomes approximately 41.6%. The adjustment is a chosen stress test, not a measured error allowance or confidence interval. [3]
The distinction matters in practice. A marketer can use this result to question an overly broad audience label. It cannot establish that a particular Dutch brand has a 48.5% overlap, or that nearly half its revenue should come from organizational buyers.
The coffee campaign starts with the buying task
Return to the fictional coffee supplier. For the home buyer, the campaign team chooses a simple task: help someone decide whether this blend suits the coffee they make at home. Relevant details could include the flavor description, available grind, pack size and delivery options. The example message is: “Find the right grind for your morning coffee.”
For the workplace buyer, the team chooses a different task: arrange a dependable way to replenish coffee for a shared kitchen. Before writing the campaign, the team checks which quantities, delivery arrangements and billing options the supplier actually offers. Its example message becomes: “Plan the next coffee delivery for your workplace.”
Neither message requires a claim that consumers are emotional or businesses are rational. Both buyers may care about taste, price and reliability. The difference in this example is the purchase they are trying to organize. The brief should explain that difference in ordinary language rather than turn a customer label into a personality profile.
The next step should honor the promise. A home-coffee message might lead to the blend page with grind choices. A workplace message might lead to the relevant delivery information on that same site. If a company genuinely supports an inquiry about larger orders, the campaign can offer that route. It should not promise account terms or a subscription that the supplier cannot provide.
A separate site or checkout is a possible operating choice, not a conclusion from these data. Sometimes clearer information on an existing product page is enough. The useful review question is: after this person clicks, can they find what they need to complete the task we described?
The same discipline applies to a creator working on the campaign. The creator needs to know which buying situation the content represents. A demonstration of making one cup can suit the home brief; showing how the product fits a shared kitchen can suit the workplace brief. These are illustrative creative choices, not measured performance findings.
A training provider has a different customer question
Consider a second fictional business: a provider offering a short practical course. An individual learner wants to choose a suitable course and reserve a place. An employer wants several colleagues to attend, perhaps with different experience levels or availability. The course topic could be the same, but the organization of the purchase changes.
For the individual, a useful campaign might explain what the course covers, prerequisites, dates and how to enroll. For the employer, the brief might instead ask whether several places are available, whether the schedule works for the group and how the provider handles a group booking. A campaign should mention those arrangements only when the provider offers them.
This case differs from replenishing workplace coffee. The buyer and the people using the service may be different. An employer could approve the purchase while learners decide whether the course is relevant to their work. The team needs to know whose question each piece of content answers, rather than assume that “business buyer” identifies a single person.
A useful pair of illustrative messages is “Choose a course for the skill you want to practice” and “Find a course that fits your team’s learning needs.” They lead to different questions, even when they eventually lead to the same course page. The overlap study does not measure training-provider behavior; this example shows how to turn the broader finding into a specific planning conversation.
A brief for two buying situations
Use the following brief when a business has evidence that it serves more than one customer group, or when an existing audience label leaves the buying task unclear. Complete one version for each situation. The research supplies context; the company’s actual offers, customer knowledge and operating choices supply the answers.
Buyer and purchase: [who is arranging the purchase; who will use the product or service; what they are trying to get done]. Coffee example: a person buying for home use versus someone replenishing a shared workplace kitchen.
Question before ordering: [the information this buyer needs to decide]. Home example: whether the blend and grind suit the brewing method. Workplace example: whether the available quantities and delivery arrangements suit the kitchen.
Supported promise: [one clear statement the company can fulfill]. Home example: help the customer choose among available grinds. Workplace example: explain the supplier’s existing delivery arrangements. Leave out features or terms that have not been confirmed.
Evidence in the content: [the product detail, demonstration or explanation that supports the promise]. The home brief can show the relevant preparation method. The workplace brief can explain the available pack and delivery options. Neither needs an invented testimonial or performance claim.
Next step after the click: [the actual destination and action]. Name the product information, booking page or supported inquiry route. Check that its wording matches the campaign and that the buyer can find the promised information.
Success for this campaign: [the outcome appropriate to the promised action; how the team already measures it]. A completed purchase and a qualified group-booking inquiry are different outcomes. Use a clearly defined measure that fits the intended action. Avoid combining purchases and inquiries into one unexplained success count.
For the training provider, repeat the brief with the learner and the group-booking organizer. The evidence might be course content and prerequisites for the learner, and confirmed booking arrangements for the organizer. This keeps the second brief specific to the service instead of copying the coffee supplier’s delivery questions.
Before production, read each brief as a continuous sequence: this person has this task, needs this information and can take this next step. If a link in that sequence is missing, fix the promise or the destination. Creating two audience labels alone does not resolve it. Keep a shared message where the buying tasks genuinely need the same answer.
If the answers are already clear, the exercise may confirm the existing campaign. A business serving only one relevant buying task does not need to invent a second audience because other enterprises serve both. Where two tasks are present, the team can choose which one a particular post, ad or creator brief will address. The useful output is a more specific assignment, not a requirement to double the content calendar or split every campaign.
Connect the buying task to the next step
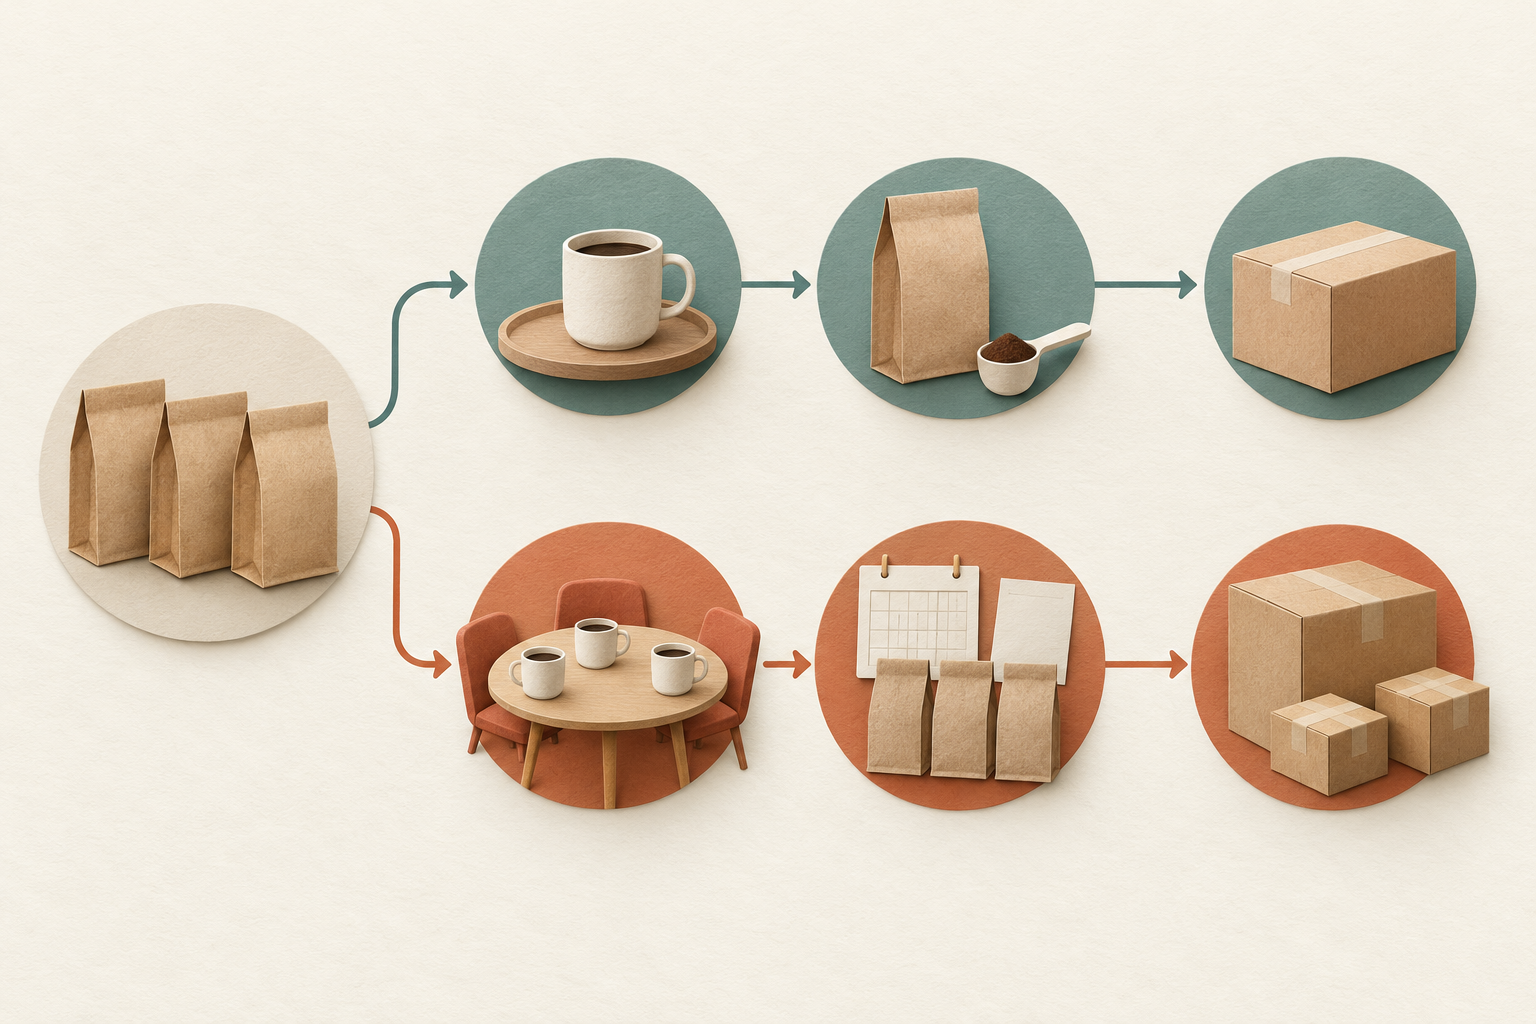
Name the buying task
Describe the purchase the person is trying to arrange.
Answer the decision question
Show the product or service information that matters for that task.
Keep the next step consistent
Send the buyer to an action the business actually supports.
How the estimates were selected and calculated
We used Eurostat dataset isoc_ec_esels, survey year 2025, for 2024 web sales. The scope is enterprises in the survey’s 10-or-more-persons-employed frame, across the specified nonfinancial industry aggregate. Microbusinesses and solo creators are outside that frame. A translated edition does not change the geography or population of the study. [1]
Before retrieving the outcome values, we reviewed the common manual and national methods for all 27 EU countries. We excluded Belgium, Spain, Italy and Romania because the role of item-specific reweighting remained unresolved for these measures. Poland remained unresolved because of its legal-unit versus enterprise definition. After retrieval, Estonia lacked the two customer-group estimates; France lacked the business/public-sector estimate, which was marked unreliable. The remaining 20 countries form the comparison. [4]
For each eligible country, W is the percentage of all covered enterprises with web sales, C the percentage with consumer web sales, and O the percentage with business/public-sector web sales. The calculated floor is 100 × max(0, (C + O − W) / W). It gives the smallest overlap possible in a customer mix matching those published marginal estimates. We do not observe the joint customer mix. [2]
We kept the same country scope, eligibility rules and sensitivity adjustment throughout the pilot. The prospective editorial rule required at least 18 eligible countries, with at least two-thirds reaching a floor of at least 25% both before and after the adjustment. These were chosen publication criteria, not significance tests or business targets. All 20 eligible countries passed. Adding the predeclared estimated/provisional flags added no countries. [3]
The estimates can reflect national editing, imputation and survey error. Country differences also reflect different business populations. We therefore report each country separately and do not turn their results into an EU-wide enterprise share or a market ranking. The supporting table retains all 27 countries, including the excluded ones. The downloads provide the inputs, flags, decisions and calculation method. [4] [5]
Published inputs for all 27 countries
Percentages of all covered enterprises, using the same 2025 survey and 2024 sales reference. These are the inputs to the calculation, not percentages within web sellers.
View all 27 countries and the source inputs
| Country and inclusion note | Enterprises with web sales (W) | Enterprises with consumer web sales (C) | Enterprises with business/public-sector web sales (O) |
|---|---|---|---|
| Austria | 27.20% | 22.77% | 16.26% |
| Belgium (excluded: method) | 26.30% | 19.32% | 20.92% |
| Bulgaria | 15.00% | 13.74% | 8.66% |
| Croatia | 18.39% | 14.48% | 15.23% |
| Cyprus | 23.05% | 21.92% | 9.99% |
| Czechia | 22.25% | 19.10% | 18.03% |
| Denmark | 30.69% | 23.03% | 21.46% |
| Estonia (excluded: missing estimates) | 22.09% | Not published | Not published |
| Finland | 28.45% | 21.29% | 21.79% |
| France (excluded: missing/unreliable estimate) | 16.93% | 14.45% | Not publishedUnreliable estimate (Eurostat flag u) |
| Germany | 20.04% | 16.42% | 13.96% |
| Greece | 24.45% | 22.05% | 14.11% |
| Hungary | 19.03% | 16.18% | 13.99% |
| Ireland | 31.74% | 27.75% | 17.32% |
| Italy (excluded: method) | 17.63% | 15.29% | 12.08% |
| Latvia | 17.87% | 16.66% | 11.31% |
| Lithuania | 41.30% | 27.08% | 34.89% |
| Luxembourg | 12.80% | 10.51% | 8.41% |
| Malta | 32.91% | 29.80% | 18.37% |
| Netherlands | 24.66% | 17.89% | 18.73% |
| Poland (excluded: unit definition) | 16.81% | 14.57% | 13.27% |
| Portugal | 16.88% | 15.04% | 10.26% |
| Romania (excluded: method) | 13.01% | 12.13% | 7.19% |
| Slovakia | 15.26% | 13.50% | 8.60% |
| Slovenia | 24.45% | 18.88% | 15.11% |
| Spain (excluded: method) | 26.09% | 21.10% | 16.57% |
| Sweden | 31.24% | 23.72% | 25.40% |
- Download the figure values and country labels (CSV)
- Download source inputs, flags and reproduction code (ZIP; English instructions)
The CSV contains the displayed country figures. The ZIP retains all source inputs, missing values, observation and confidentiality flags, country eligibility decisions and the analysis code. Instructions are in English. Both downloads are available without registration.
Sources and notes
- Eurostat, ICT usage and e-commerce in enterprises, 2025 survey. Dataset isoc_ec_esels; PC_ENT; GE10; C10-S951_X_K. Web sales include websites, apps and marketplaces, excluding EDI-only ordering. The source frame covers selected industries and enterprises with at least 10 persons employed. National frame and collection conventions differ.
- Influence IQ calculations from E_AWSELL, E_AWS_B2C and E_AWS_B2BG. The 2025 manual defines customer-group counts from positive, nonblank sales values. The published estimates may include editing or imputation. For C/W and O/W, the minimum compatible joint share is max(0, C/W + O/W − 1); it is not a recovered survey joint cell or guaranteed population lower bound.
- Sensitivity: reduce C and O by 0.5 percentage points, with a zero floor, and increase W by 0.5 points, capped at 100%. Recalculate each compatible overlap. This analyst-chosen perturbation is neither a source rounding interval nor a confidence interval. The 18-country, two-thirds and 25% editorial thresholds were fixed before outcome retrieval.
- Seven countries are excluded from the overlap figure: Belgium, Spain, Italy and Romania for unresolved item-weight compatibility; Poland for unresolved unit aggregation; Estonia for missing customer-group estimates; France for a missing organizational estimate flagged u (unreliable). The source-input table preserves published values without calculating excluded-country floors. National source links and decisions are in the analysis package.
- Source dataset updated June 15, 2026; retrieved October 18, 2026. Eurostat data are reused with attribution. Influence IQ selected and analyzed the data and supplies the examples and translations. Eurostat is not responsible for these calculations, interpretations or translations. The analysis package includes the public inputs, observation flags, metadata decisions and reproduction code.
This English article is the source edition. All language editions describe the same European enterprise estimates for 2024 web sales and the same fictional planning examples. Translation does not turn the findings into a benchmark for another country or for microbusinesses.