Marketplace vs. own online store: a study of EU businesses
Having a checkout on your own website does not tell you how much business still comes through a marketplace. We looked at how EU firms combined the two, using Eurostat data on sales in 2024.
Sales in 2024, reported in Eurostat’s 2025 enterprise survey. The study covers selected EU industries and businesses with at least 10 people employed. Analysis completed October 17, 2026.
Abstract
A marketplace and a business’s own online store often work alongside each other. In our analysis of Eurostat’s data on 2024 sales, about 84% of small EU firms selling through marketplaces received at least 20% of their web sales through those marketplaces, compared with about 66% of large marketplace sellers. Small means 10–49 people employed; large means 250 or more. These figures count businesses reaching a sales-share threshold, not the share of all sales that marketplaces receive.[1][2]
Among firms selling through both marketplaces and their own websites or apps, around three-quarters of small firms still reached the threshold, against about 58% of large firms. An own store can coexist with a substantial marketplace contribution. For a team planning social content, the useful next step is to understand each ordering route before deciding where a campaign should send customers. The study measures sales channels, not profit or the effects of choosing one route over another.[1][2]
Imagine a business that has invested in its own store. Its product pages are complete, its checkout works, and its social profiles link to the site. It would be easy to assume that the marketplace it also uses has become a small sideline. The existence of the store cannot tell us that. We need to know where orders are actually placed.
That distinction matters when a small team is choosing the destination for its next campaign. A post can introduce a product, explain a service or answer a customer’s question. The link then asks that person to continue somewhere specific. Choosing that destination calls for a closer look at the business than simply checking which sales channels it has.
We used Eurostat’s enterprise data to ask two questions: how common is marketplace selling, and how often does it account for at least a fifth of web sales among the firms that use it? The answers tell different stories. We then checked whether the second pattern survives when businesses without an own-store sales route are taken out of the comparison.
One business can receive web orders through both routes
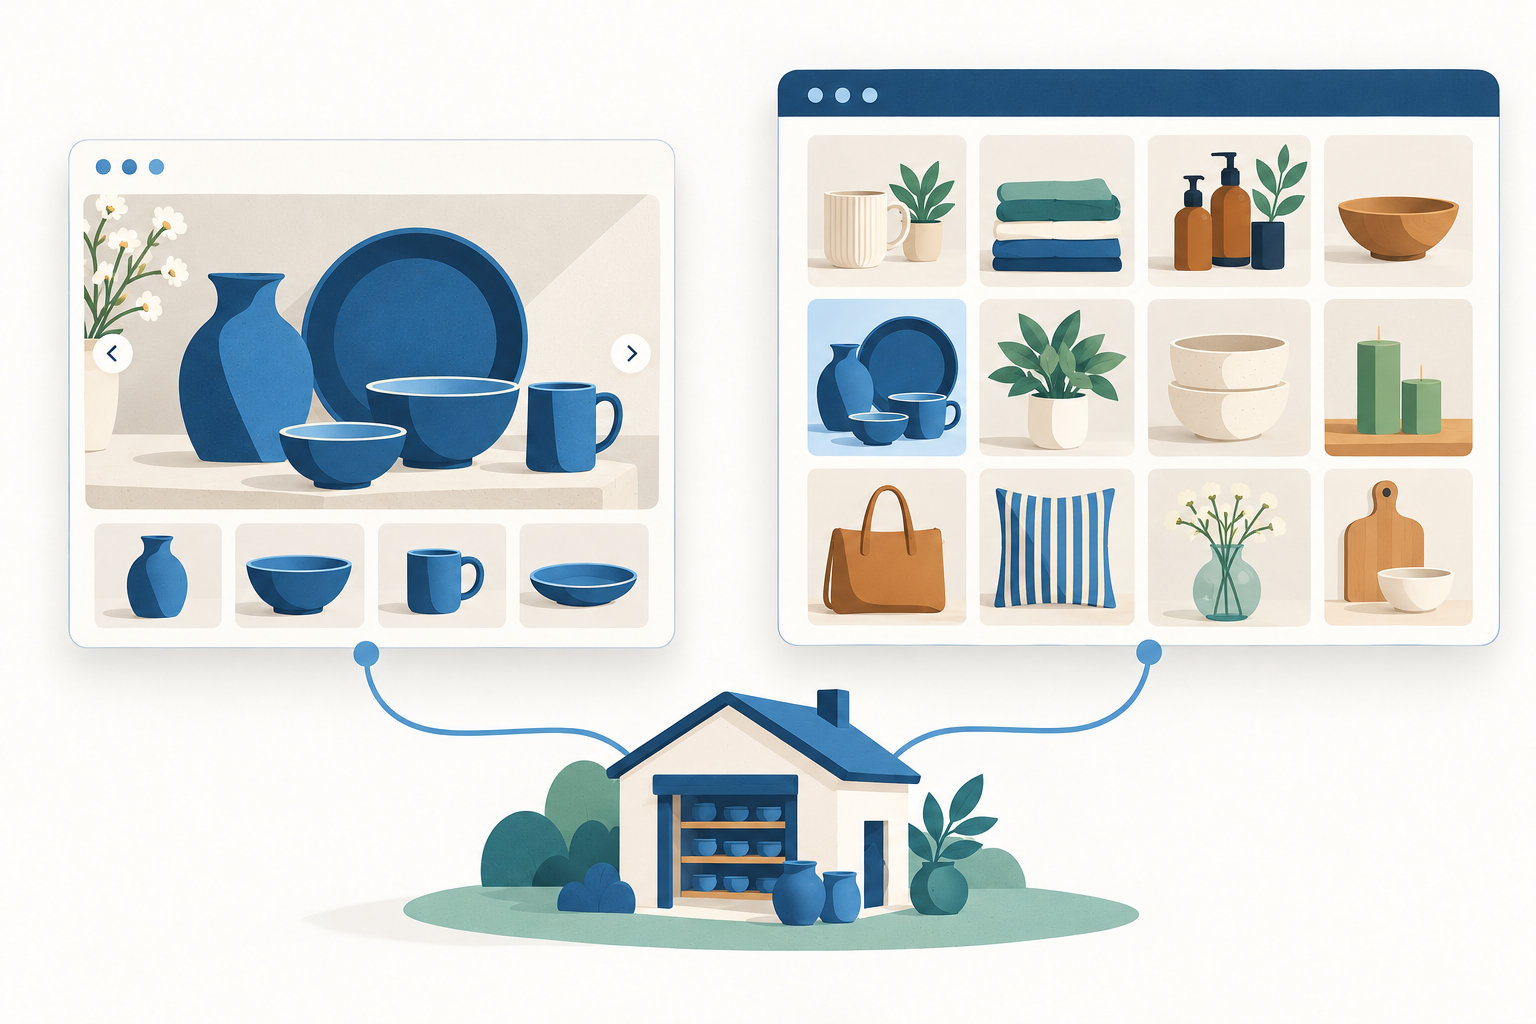
- Own website or app
- External marketplace
- Ceramics workshop
A marketplace is ecommerce too
“Marketplace vs. ecommerce” is a common way to frame this decision, but a marketplace is itself a form of ecommerce. The useful comparison is between taking orders through a business’s own website or app and taking them through an external marketplace. A business can use either route, or both.[2]
This study follows those ordering routes. An own store means the business receives web orders through its own website or app. Marketplace selling means it receives them through a marketplace website or app. The distinction is about where orders are placed, not whether the business coded its checkout software itself. It also applies to services and business customers, not just retail products.
A firm classified as selling only through marketplaces may still have an informational website. It may also take orders offline or through other electronic systems. “Marketplace-only” here means no web sales through its own website or app. It does not mean that every sale the business makes passes through a marketplace.[1][2]
Keeping those definitions straight prevents a practical mistake. Building a website, opening an online store and changing the mix of orders are different developments. A team should check which of them it actually needs before treating a new website as the answer.
An own store can sit alongside substantial marketplace sales
One possible explanation is that small marketplace sellers are more likely to have no own-store sales. In the EU figures, 33.7% of small marketplace sellers used marketplaces as their only web-sales route, compared with 18.2% of large marketplace sellers. These firms necessarily receive all their web sales through marketplaces, so they all meet the 20% threshold.[1][6]
We therefore repeated the calculation only for firms selling through both routes. After removing marketplace-only sellers from the threshold group, an estimated 75.5% of small firms using both routes still received at least a fifth of web sales through marketplaces. The corresponding estimates were 69.5% for medium-sized firms and 58.2% for large firms.
For small firms, the calculation is (7.50 − 3.02) divided by 5.93, multiplied by 100. The first two numbers are the percentages of all small firms meeting the threshold and selling only through marketplaces. The final number is the percentage selling through both their own website or app and a marketplace. Each input uses the same business population.[1]
This check narrows the interpretation. The small-versus-large difference is not explained solely by the proportion using marketplaces as their only web-sales route. It remains among businesses with own-store sales too. That does not show what caused the difference: customer demand, industry, product mix and other circumstances can vary between the groups.
An own store therefore should not be treated as evidence that marketplaces have become marginal. Equally, a substantial marketplace contribution is not evidence that an own store has failed. The two routes may be serving different purchases. The data tell us to examine that possibility, not which route deserves the next euro of spending.
The pattern remains among businesses using both routes
Percentage of businesses selling through both their own website or app and marketplaces that received at least 20% of web sales through marketplaces in 2024.
| Business size | Share of sellers using both routes reaching the 20% threshold |
|---|---|
| Small: 10–49 people employed | 75.5% |
| Medium: 50–249 people employed | 69.5% |
| Large: 250 or more people employed | 58.2% |
Small marketplace sellers more often reach the 20% threshold across the EU
The small-firm share reaching the 20% threshold was higher than the large-firm share in 23 of the 26 EU countries with both estimates available. Malta, the Netherlands and Slovakia were the exceptions. Germany’s large-firm threshold estimate is unavailable and flagged for low reliability; it is missing, not zero.[1]
Restricting the comparison to firms with both sales routes also gives a small-firm lead in 23 of 26 countries, but the exceptions change to Bulgaria, Malta and the Netherlands. The distinction is a reason to show both comparisons. It would be misleading to assume that one description fits every market.
Country adoption and sales-share figures can diverge too. In Lithuania, 34.74% of small firms sold through marketplaces, compared with 9.22% in Ireland. Yet among their marketplace sellers, the estimated share reaching the threshold was 82.4% in Lithuania and 91.4% in Ireland. More widespread adoption does not necessarily mean a larger share of marketplace sellers cross the 20% web-sales threshold.
These are descriptive comparisons, not a ranking of marketing quality. The countries have different mixes of industries, and this analysis does not adjust for them. The Netherlands carries source flags for a break in series on relevant small-firm measures; we retain those flags and use the figures as a single-year comparison. The country table preserves unavailable values and the source notes.
The country comparison
Share of marketplace sellers receiving at least 20% of web sales through marketplaces in 2024. The difference is small minus large businesses, in percentage points. Small means 10–49 people employed; large means 250 or more.
View all 27 countries and source flags
| Country | Small businesses | Large businesses | Small minus large |
|---|---|---|---|
| Austria | 81.1% | 63.0% | 18.1 percentage points |
| Belgium | 68.3% | 55.2% | 13.1 percentage points |
| Bulgaria | 84.0% | 82.7% | 1.3 percentage points |
| Cyprus | 91.4% | 79.1% | 12.4 percentage points |
| Czechia | 77.8% | 63.2% | 14.7 percentage points |
| Germany | 86.7% | Not availableLow reliability | Not availableLow reliability |
| Denmark | 74.6% | 57.4% | 17.2 percentage points |
| Estonia | 78.1% | 70.1% | 8.0 percentage points |
| Greece | 88.0% | 78.0% | 10.0 percentage points |
| Spain | 87.2% | 76.6% | 10.6 percentage points |
| Finland | 72.0% | 47.7% | 24.3 percentage points |
| France | 81.3% | 50.9% | 30.4 percentage points |
| Croatia | 85.2% | 78.6% | 6.6 percentage points |
| Hungary | 81.5% | 42.4% | 39.1 percentage points |
| Ireland | 91.4% | 76.0% | 15.5 percentage points |
| Italy | 86.6% | 69.6% | 17.0 percentage points |
| Lithuania | 82.4% | 66.7% | 15.7 percentage points |
| Luxembourg | 89.1% | 67.6% | 21.6 percentage points |
| Latvia | 85.5% | 67.8% | 17.8 percentage points |
| Malta | 83.2% | 88.9% | -5.7 percentage points |
| Netherlands | 65.5%Break in series | 67.1% | -1.5 percentage pointsBreak in series |
| Poland | 86.4% | 60.6% | 25.9 percentage points |
| Portugal | 76.5% | 66.4% | 10.1 percentage points |
| Romania | 84.9% | 82.0% | 2.9 percentage points |
| Sweden | 75.3% | 53.6% | 21.8 percentage points |
| Slovenia | 87.1% | 59.6% | 27.5 percentage points |
| Slovakia | 57.1% | 61.7% | -4.6 percentage points |
A ceramics workshop can use both routes without splitting sales equally
Consider a fictional ceramics workshop with 12 people employed. During one year it receives €420,000 in orders through its own store and €180,000 through marketplaces. Its web sales total €600,000. It also makes €400,000 in offline sales. These amounts are invented to explain the calculation, not drawn from a customer or presented as expected results.
Marketplaces account for 30% of its web sales: €180,000 divided by €600,000. The business meets the study’s 20% threshold even though its own store accounts for the other 70%. Relative to its €1,000,000 in total sales, the marketplace share is 18%. Both descriptions are correct because they use different denominators.
Suppose the team is preparing posts for a new range. The fact that it has an own store does not settle where those posts should lead. It could review the product details, ordering steps and customer questions at each destination. A post promising help choosing a size should lead somewhere that supplies that help; a post advertising a particular offer should lead to the place where that offer can actually be ordered.
The 30% share alone cannot answer whether the marketplace is worthwhile. The team would also need its costs, margins, returns and the staff time associated with each route. Those details are not in this study. The worked example is useful because it separates three questions the team can otherwise blur together: where it sells, how much each route contributes, and whether the economics work.
Choose a campaign destination for the customer’s next task
Connect the post to the right next step
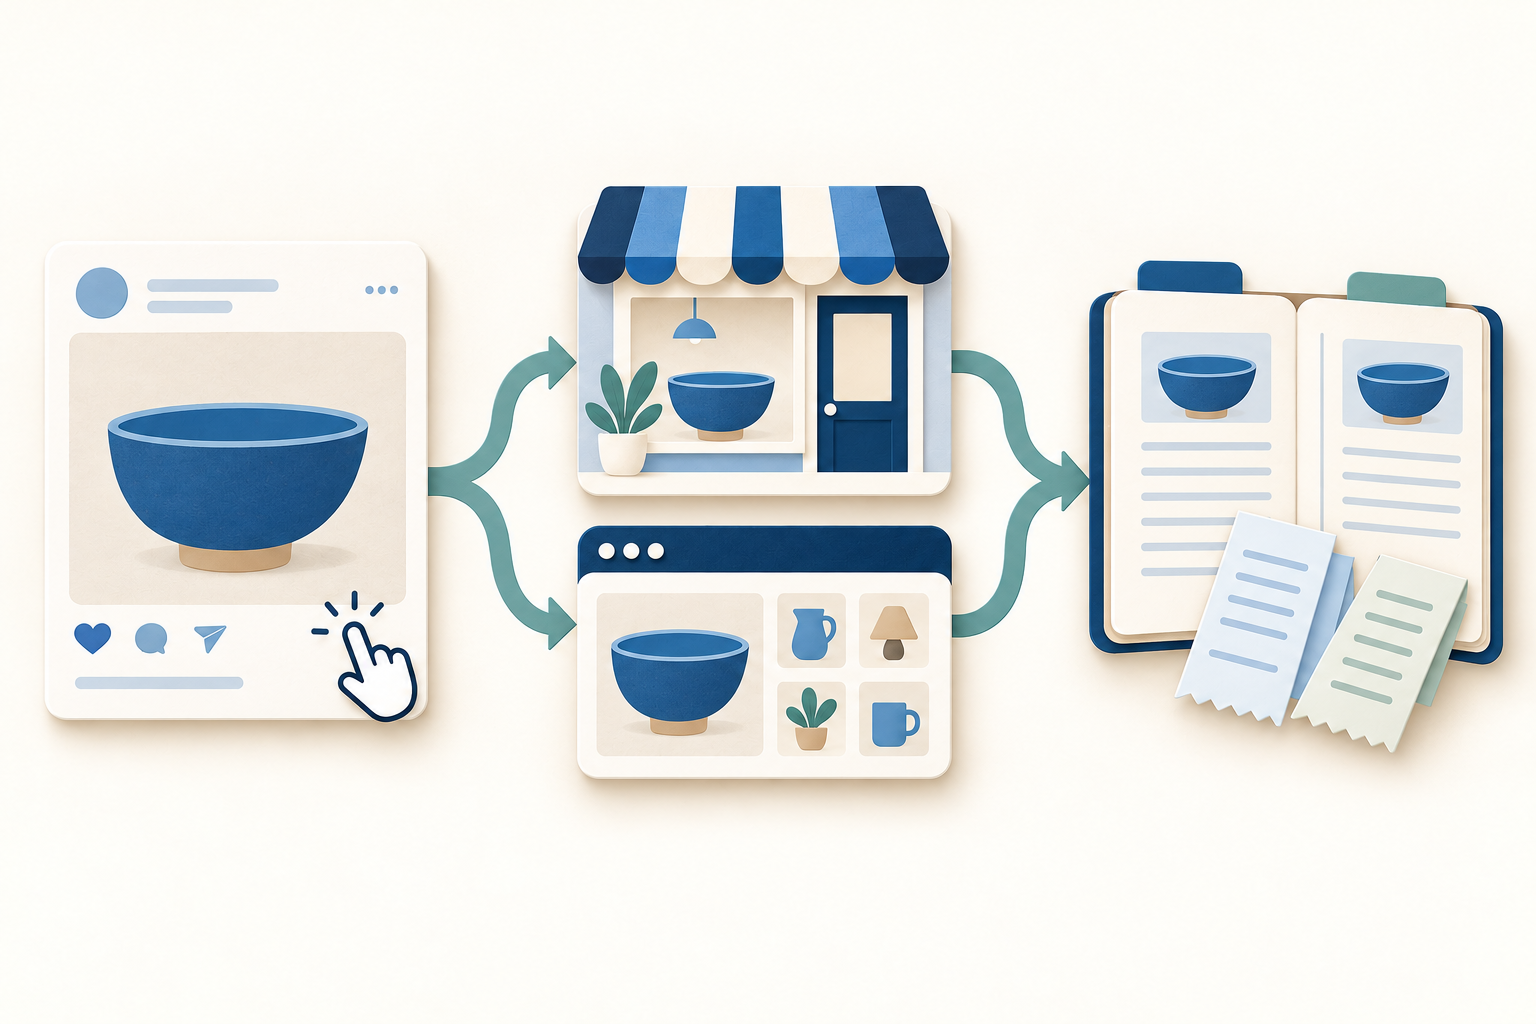
Start with the customer’s question
Identify what the post promises to explain or offer. Check which destination can fulfill that promise.
Review the ordering route
Compare accurate information, availability, ordering steps and the business’s costs at each destination.
Check the actual mix
Keep each route’s share of web sales separate from its share of all business sales. Review the results using existing measurement.
Start with the customer’s immediate question. Someone comparing specifications may need a detailed product page. Someone responding to a time-limited offer needs the exact price, availability and ordering conditions. Someone arranging a service may need booking details. Review the actual pages you can maintain before deciding which destination best answers that question.
Compare both destinations against the same practical checks. Can a person find the product or service promised in the post? Are the price, availability and delivery or booking details current? Can they complete the next step on their phone? A marketplace might be the better fit for one campaign and an own store for another. The choice should follow what the customer needs to do.
For the fictional ceramics workshop, a post explaining how to care for a glaze could lead to an own-store page that combines care advice and the relevant products. A post promoting a bundle offered only through a marketplace should lead to that offer. In each case, the destination follows the promise in the post. There is no reason to send every customer through both routes.
A short channel review before the next campaign
First, use existing order records to list web-sales value by ordering route for the same period. Keep own-store orders and marketplace orders separate, then calculate each as a share of their combined web-sales total. Keep offline sales in a separate line so that a share of web sales is not mistaken for a share of all business sales.
Use a consistent sales-value basis. A marketplace payout after fees is not directly comparable with an own-store order total before fees. Mixing the two can make one channel look smaller for an accounting reason. Reconcile the sales totals first, then compare the relevant fees, returns and other costs separately.
The fictional workshop’s review would start with €420,000 and 70% of web sales for its own store, and €180,000 and 30% for marketplaces. The next entries would be its actual costs and recurring customer questions for each route. Check the records for any missing cost before assigning it a value. This creates a more useful decision than treating the study’s 20% cutoff as a target every business should meet.
Finally, choose one concrete action for the next campaign: correct a missing delivery detail, improve the product explanation or change the destination to match the offer. Use the business’s existing measurement to review the result. The order route is not the same as the discovery source: someone may see a social post and order elsewhere later. A change in channel sales alone does not prove that the campaign caused it.
How we calculated the comparisons
We analyzed Eurostat’s isoc_ec_esels dataset, using the 2025 survey observations on sales in 2024. The population covers enterprises with at least 10 employees and self-employed persons in manufacturing, construction and the other covered non-financial industries. It excludes firms with fewer than 10 people employed and is not a dedicated survey of online retailers or creators. We use Eurostat’s supplied EU aggregate, not an average of country percentages.[1][2][3]
The main measure divides the percentage of enterprises receiving at least 20% of web sales through marketplaces by the percentage with any marketplace web sales. For firms using both routes, we subtract marketplace-only sellers from the threshold numerator and divide by sellers using both. The inputs use matching country, year, industry scope, business size and percentage-of-enterprises units. Source values, formulas and quality flags are included in the downloads.[1]
Germany’s published large-firm threshold estimate is unavailable because it is flagged for low reliability. Eurostat includes low-reliability national estimates in its EU aggregates, so we retain the published EU figures while leaving Germany out of the country counts that require this estimate. The country table shows an unavailable value, not zero. This differs from Eurostat’s treatment of confidential national values, which it excludes from EU aggregates.[3][6]
We checked the calculations against Eurostat’s alternative percentages of web sellers and checked whether the channel categories reconciled. One source discrepancy remains: for Lithuanian medium-sized firms, combining own-store and marketplace categories yields 43.81% with web sales, whereas the published web-sales total is 43.85%. A separate retrieval reproduced it. We preserve the values and do not present that composition as an exact total. The discrepancy does not enter the threshold-to-marketplace calculation or the small-versus-large country comparison.[1]
The published inputs are rounded to two decimal places. We tested each headline calculation against values within 0.005 percentage points of each input. The small-versus-large headline differences and reported country directions survive this rounding check. These ranges concern display precision, not survey confidence intervals. The extract does not supply the respondent data or survey covariance needed to estimate uncertainty for our derived comparisons.
This is a snapshot of reported sales routes for one year. It cannot establish why firms choose them, whether one route is more profitable, or what would happen if a firm changed its mix. Earlier Eurostat and OECD work has already compared ecommerce channels. Our contribution is the calculation among marketplace sellers, the further comparison among sellers using both routes, and the country checks on the latest sales year available in this extract.[2][4]
The CSV includes source percentages, calculated shares and source quality flags. Numeric fields use a decimal point for reuse in analysis.
Sources and notes
- Eurostat, E-commerce sales of enterprises by size class of enterprise (isoc_ec_esels), accessed October 17, 2026. Survey year 2025; sales reference year 2024. Calculations use PC_ENT, C10-S951_X_K, the EU aggregate and individual EU countries. Indicators: E_AWSELL, E_AWS_COWN, E_AWS_CMP, E_AWS_CMP_GE20, E_AWS_CBOTH and E_AWS_CMPQ. Calculations and source-quality notes are available in the analysis package.
- Eurostat, E-commerce statistics, data extracted February 2026. Explains the preceding-year sales reference period, own-website/app and marketplace routes, and the difference between web sales and other electronic orders. An enterprise may sell through both web-sales routes.
- Eurostat, ICT usage in enterprises metadata, sections 3.3–3.6 and 18.5. The covered industry aggregate includes NACE Rev. 2 sections C–J and L–N and group 95.1. Size counts employees and self-employed persons. EU aggregates retain national estimates flagged as unreliable; confidential national data are excluded. The unavailable German large-firm threshold cell carries the low-reliability flag, so it is omitted from our country-pair counts without removing the supplied EU estimate.
- OECD, The Digital Transformation of SMEs (2021), chapter on online platforms, Figure 3.4. Prior work compares marketplace use and the 20% sales threshold among online sellers. This article uses a marketplace-seller denominator and a further comparison among firms selling through both routes; it does not claim to be the first research on ecommerce channels.
- Eurostat’s reuse notice permits reuse of the statistical data with attribution. Calculations, interpretation and translations are by Influence IQ. Eurostat is not responsible for these adaptations.
- Eurostat, European businesses statistics compilers’ manual for ICT usage and e-commerce in enterprises, 2025 edition. Module B, question B3, printed page 38 assigns 100% of web sales to the single route for firms using only one route, supporting the dual-route calculation. Section 5.2, printed page 253, states that unreliable national estimates are included in EU aggregates while confidential national data are excluded.
Calculations, interpretation and translations are by Influence IQ. Eurostat is not responsible for these adaptations.