Website features beyond the catalog: what Brazilian online advertisers report
A product catalog, a chat service and customer support do different jobs. Our analysis of Brazil’s TIC Empresas 2025 survey looks at which of these website features the same businesses report together, and what a merchant can learn from the differences.
Brazilian enterprises with 10 or more people working in selected industries. TIC Empresas 2025 edition; fieldwork February 2025–January 2026. Analysis completed October 17, 2026.
Abstract
Among Brazilian businesses that reported paid online advertising and a website, an estimated 12.5% reported a product or service catalog but neither website chat nor after-sales support or customer service. Another 39.4% reported all three. These weighted estimates use public, confidentiality-treated microdata from TIC Empresas 2025, covering formal enterprises with 10 or more people working in selected industries. The 95% confidence intervals are 10.1%–15.0% and 35.5%–43.4%, respectively.[1]
The study examines reported feature combinations, not the quality of websites or the destinations of actual ads. Businesses reporting advertising were more likely to report both support items than explicit nonadvertisers with websites; allowing for their different size composition left a similar gap. The practical question is how a visitor gets product information and help, whether on the site or through a clearly identified alternative.
Imagine two colleagues reviewing a business website. One opens the product catalog and sees a useful explanation of what the company sells. The other asks what happens when a visitor needs an answer that is not on the page. They have looked at the same site, but they are checking different jobs.
A list of common website features does not reveal how those jobs fit together. Knowing how many firms report a catalog and how many report chat cannot tell us how often both belong to the same business. Nor does a chat button tell us who will handle a question about an existing order.
We used respondent-level data from Brazil’s NIC.br/Cetic.br to examine those combinations among firms already reporting paid internet advertising. This is evidence about reported website functions. It gives a merchant a way to ask better questions about a site, without turning a common feature into something every business must install.
One business website can help with different customer questions
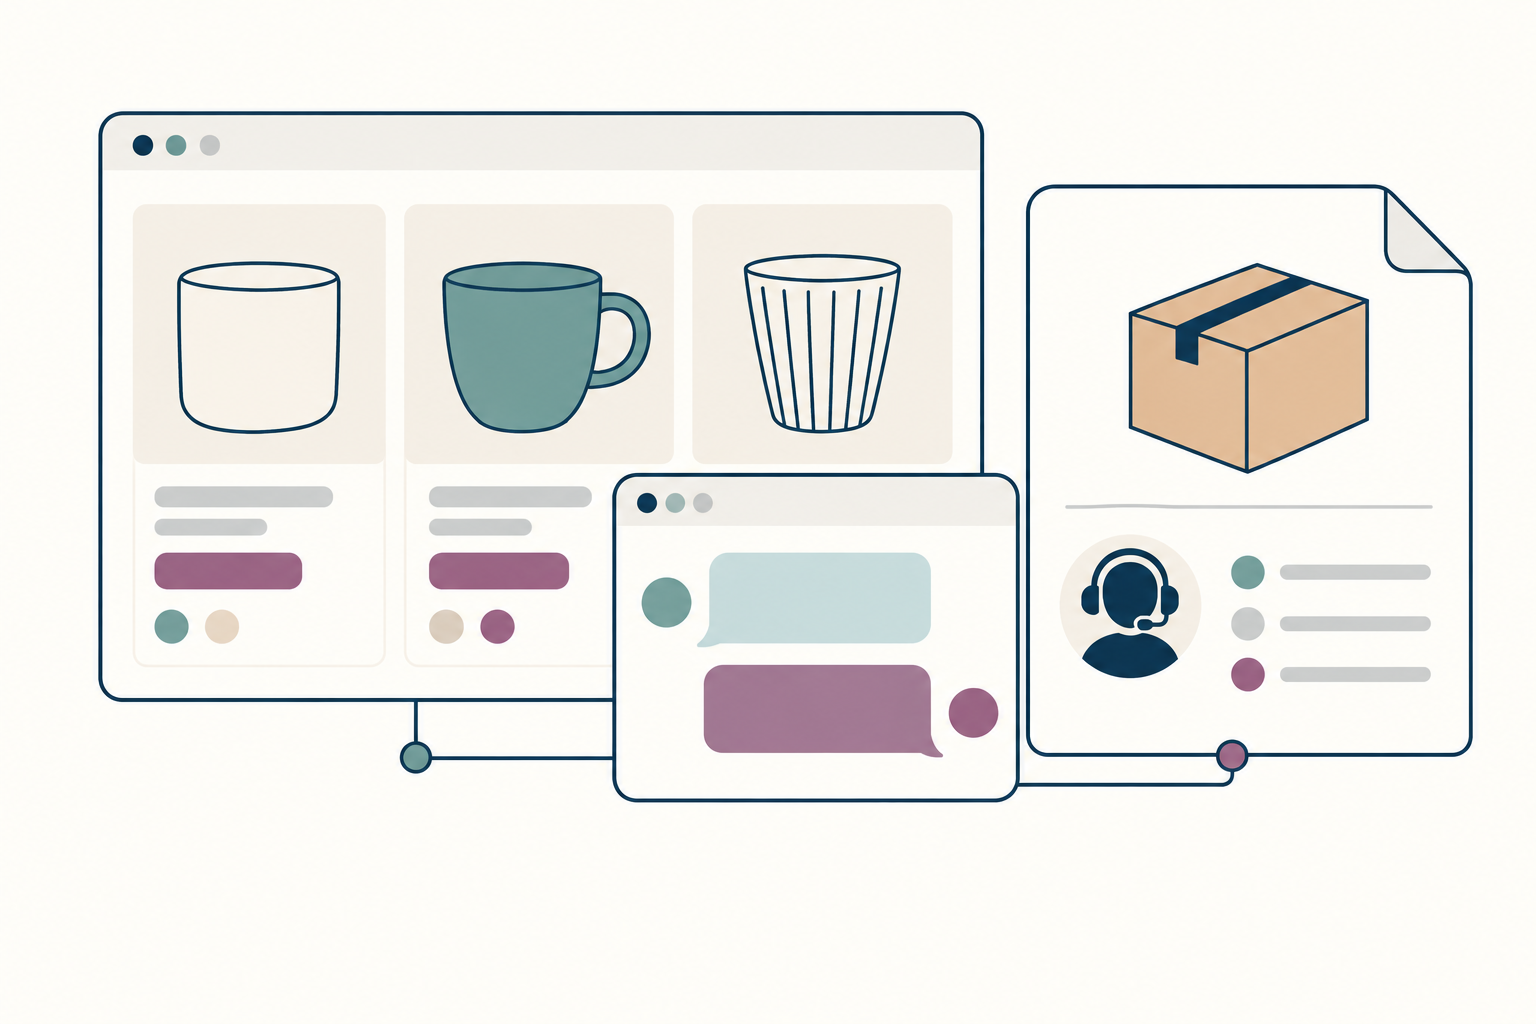
- Product or service information
- A customer conversation
- After-sales support or customer service
Three website features, with overlapping roles
The survey asks whether a business’s website provided particular features during the previous 12 months. We selected three: a catalog of products or services; a chat service for customer support; and after-sales support or customer service, described in Portuguese as SAC. The last item is broader than help after a purchase.[2]
Chat can mean a person responding, a virtual agent or a chatbot. These data cannot separate human chat from AI. The chat and customer-service questions can also describe overlapping activities: the same conversation might help a visitor choose a product and later resolve an order question.
We therefore describe combinations of answers, rather than three independent departments or stages of maturity. A business reporting chat but not the broader service item has given that answer pattern. It has not demonstrated that its chat never handles after-sales questions.
The respondent is the business, not a particular page. A firm with several sites or operating locations supplies an enterprise-level answer. That makes the results useful for describing reported arrangements across businesses, but it prevents a page-by-page audit from these data. A reader should not infer that every page offers the reported feature, that a catalog is up to date, or that a chat service is available at a particular hour. Those checks belong in the practical review below.[2][3]
The population matters too. This is a survey of formal Brazilian enterprises with at least 10 people working, in specified industries. It excludes businesses below that threshold and several sectors. “People working” includes more than salaried employees. It is not a worldwide sample of small shops or individual creators.[3]
A catalog does not tell us which support features accompany it
In the advertiser-with-website group, 12.5% reported a catalog but neither of the two support items. The estimate comes from 156 respondents within a 1,353-respondent group, using the survey weights. Its 95% confidence interval is 10.1%–15.0%.[1][4]
At the other end of this particular comparison, 39.4% reported the catalog and both support items, with a 95% confidence interval of 35.5%–43.4%. These are two selected combinations, not the whole distribution. Other firms reported different combinations or had an unknown answer.
That distinction is the reason to examine the same respondents. Cetic already publishes the separate prevalence of website features. Our calculation asks which ones occur together within a defined group. A catalog percentage alone cannot reveal whether those businesses also reported chat and wider customer-service functions.[5]
The catalog-with-neither pattern does not identify a failed website. A firm might handle questions by phone, through messaging or at its premises. The useful follow-up is whether a visitor can find that alternative, understand what to ask and reach someone who can help. None of those qualities is measured by this survey.
Two catalog and support combinations among online advertisers
Weighted percentage of businesses reporting paid internet advertising and a website. Brazil, TIC Empresas 2025 edition; selected industries with 10+ people working. Domain: 1,353 public-file respondents.
| Reported combination | Estimate | 95% interval: lower | 95% interval: upper |
|---|---|---|---|
| Catalog; neither chat nor service | 12.5% | 10.1% | 15.0% |
| Catalog, chat and service | 39.4% | 35.5% | 43.4% |
Chat and broader customer service often appear together
Among advertisers with websites, 44.0% reported both chat and after-sales support or customer service. Another 17.3% reported chat but not the other item, and 16.9% reported the other item but not chat. Neither item was reported by 20.4%. The remaining 1.4% had an unknown answer to at least one of the two questions.[1][4]
The two one-item patterns are close. Their estimated difference is 0.4 percentage points, with a 95% confidence interval from −4.8 to 5.6 points. That does not establish that one pattern is more common. The figure shows their uncertainty alongside the estimates, rather than presenting a ranking.
For a merchant, the separation helps distinguish the channel from the work it needs to support. A conversation can begin in chat, while a more involved request goes to another person or another route. A site can also explain how to get help without offering chat at all.
When reviewing a website, ask what happens after a visitor makes contact. Can the person receiving the message answer the question? If not, is the next step clear? These are practical checks suggested by the different reported combinations, not conclusions about the quality of any surveyed business.
Which support items advertisers report together
Weighted percentage of businesses reporting paid internet advertising and a website, whether or not they report a catalog. Brazil, TIC Empresas 2025 edition; selected industries with 10+ people working.
| Reported combination | Estimate | 95% interval: lower | 95% interval: upper |
|---|---|---|---|
| Both chat and service | 44.0% | 39.9% | 48.2% |
| Chat yes; service no | 17.3% | 13.8% | 20.8% |
| Service yes; chat no | 16.9% | 13.5% | 20.2% |
| Neither chat nor service | 20.4% | 16.8% | 24.0% |
The support difference remains after allowing for firm size
We compared advertisers with businesses that explicitly reported no paid internet advertising, restricting both groups to those reporting a website. Both support items were reported by 44.0% of advertisers and 22.8% of nonadvertisers. The estimated difference is 21.2 percentage points, with a 95% confidence interval of 15.8–26.6 points.[1][4]
A possible explanation is that the groups contain different mixes of small and large firms. To check that possibility, we calculated the result within each of the three registered size groups, then applied the same size mix to both advertising groups. The reference mix is that of website respondents with a known yes-or-no advertising answer.
After this adjustment, the difference is 21.3 percentage points, with a 95% confidence interval of 15.9–26.7 points. Registered firm size alone therefore does not account for the observed contrast. The calculation does not adjust for industry, business model, staffing, resources or the reasons a business chose to advertise.
This is not evidence that buying ads causes firms to add support features, or that adding those features makes ads perform better. The survey does not establish which came first. It also does not show whether ads led to the reported website. The comparison offers context for reviewing a business’s arrangements, not a predicted return on a new feature.
Both support items among advertisers and nonadvertisers with websites
Weighted percentage reporting website chat and after-sales support or customer service. Brazil, TIC Empresas 2025 edition; selected industries with 10+ people working. Advertising groups use explicit yes/no answers.
| Group | Estimate | 95% interval: lower | 95% interval: upper |
|---|---|---|---|
| Paid online advertising: yes | 44.0% | 39.9% | 48.2% |
| Paid online advertising: no | 22.8% | 18.7% | 27.0% |
The support difference before and after allowing for firm size
Percentage-point difference in reporting both support items: advertisers minus explicit nonadvertisers, among businesses with websites. Brazil, TIC Empresas 2025 edition; selected industries with 10+ people working.
| Comparison | Estimate | 95% interval: lower | 95% interval: upper |
|---|---|---|---|
| Observed difference | 21.2 percentage points | 15.8 percentage points | 26.6 percentage points |
| Same registered-size mix | 21.3 percentage points | 15.9 percentage points | 26.7 percentage points |
A fictional shelving business follows three customer questions
Consider a fictional Brazilian supplier of modular shelving. It has a product catalog, pays for online advertising and handles inquiries through a messaging number. The marketing manager and service coordinator choose one product to review. This is an illustrative example, not a company observed in the survey.
Their first question is whether a customer can tell which sizes are available. The catalog lists the standard sizes but does not explain how to ask about a different configuration. The team decides to place the appropriate inquiry route beside that information. It has identified a specific unanswered question, not a general need for more website features.
Their second question is what happens when someone uses that route. The messaging number reaches the sales team, which can answer product questions. A request about an existing order needs the service coordinator instead. The team checks whether staff can pass along the relevant order information without making the customer start the explanation again.
Their third question concerns the information a customer receives after ordering. The confirmation identifies the service contact, but the product page only shows sales inquiries. The team decides where each contact should appear and who will keep the wording current. It can do this before deciding whether a website chat service would be useful.
The proposed changes come from the fictional business’s review. They do not follow automatically from the Brazilian percentages. A business with different customers or support arrangements could make a different choice. Any effect on inquiries, service quality or sales would require its own evidence.
A website review worksheet built around customer questions
Follow the question, choose a route, and test the response
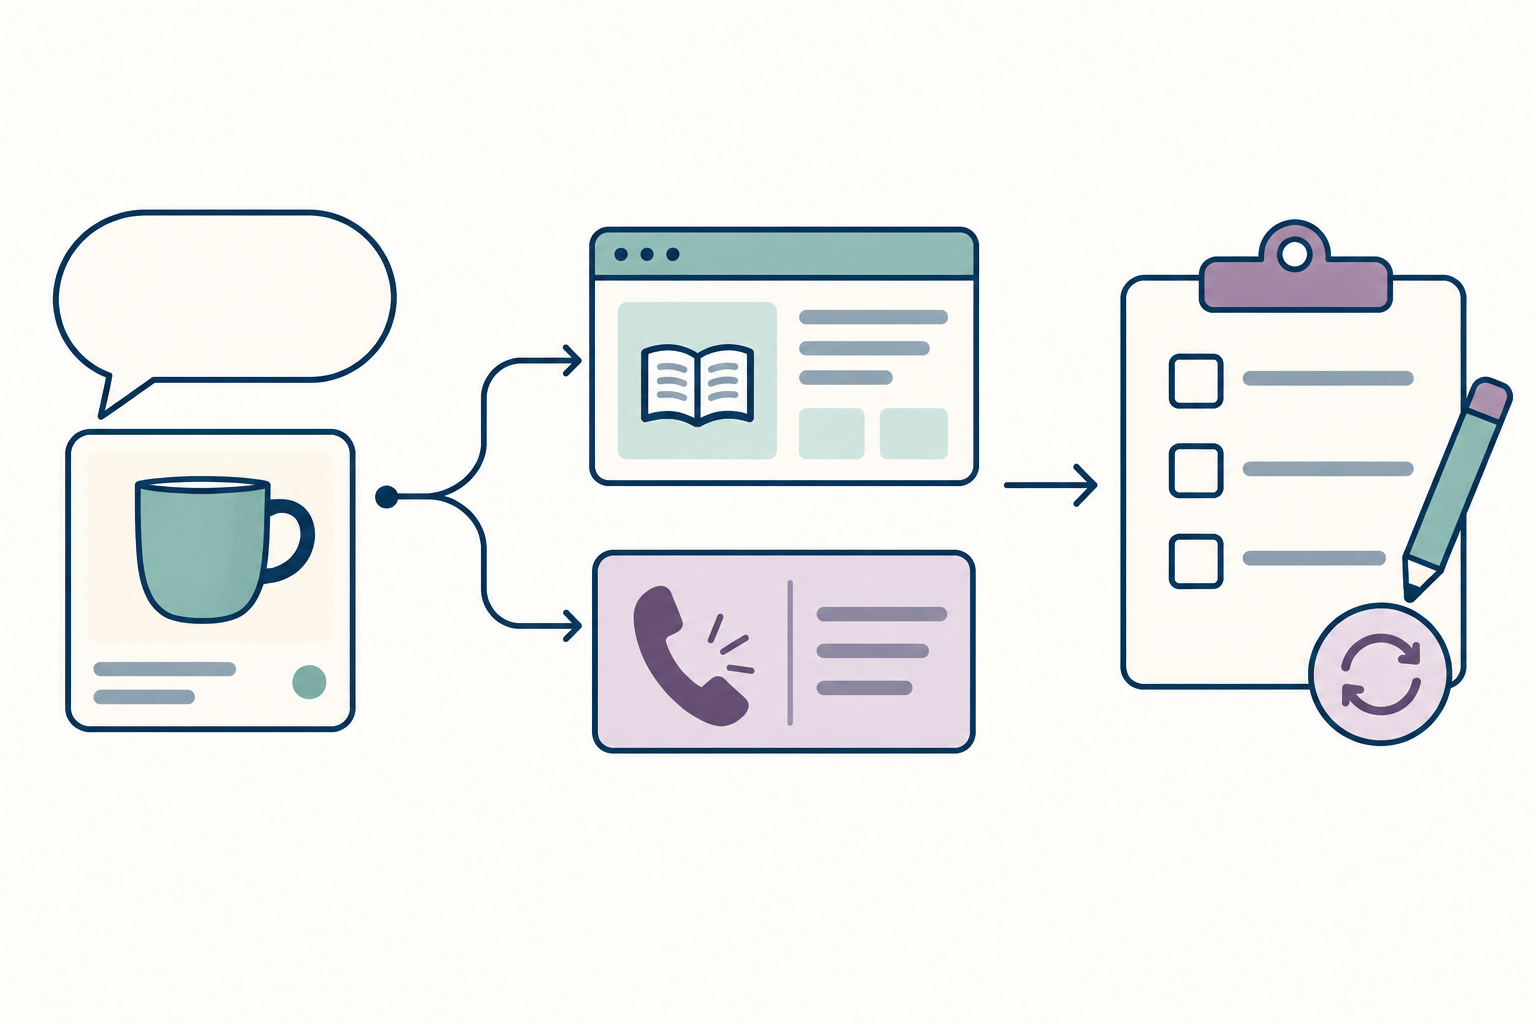
Start with a question
Choose something a visitor needs to know before buying or when using an existing product or service.
Make the route clear
Locate the answer on the website or explain the appropriate alternative contact route.
Assign and test
Name who handles the request, check what happens next and revisit any change.
Choose one product or service and three realistic questions: one about choosing it, one requiring a conversation, and one about an existing order or service. Use a separate line for each question. Record the starting page, available answer or contact route, responsible person, expected next step and follow-up date.
Find the answer. Read the page as someone who does not already know the business. Identify which question the catalog or service description answers and what remains unclear. Record the specific missing detail. A list of features is less useful than knowing that a customer cannot find, for example, which options are available.
Choose a clear route. If the answer belongs somewhere else, follow the link or instruction. That route might be another page, email, telephone or messaging. Check that the visitor can understand what the route is for and any stated availability. The worksheet does not presume that every question belongs in website chat.
Name the person and next step. Identify who receives the request, what information they need and what happens when another colleague must respond. Compare the public wording with the actual arrangement. Do not promise an immediate response simply because a chat interface or contact button is visible.
Test and revisit. Walk through the route on a phone and a larger screen, using a harmless test agreed with the team. Check that the right person receives it and that the next step matches the explanation. Give each demonstrated issue an owner, then return to the changed page or instruction to confirm it was resolved.
Choose the next website change from the question it needs to answer
Begin with a demonstrated gap in the customer’s route. It might require clearer product information, a better explanation of an existing contact option or a change in who handles a request. Installing another feature is one possible response, not the automatic conclusion.
Existing inquiries and service records can help identify repeated questions. Keep repeat conversations about the same case distinct from different customers, and separate examples of confusion from evidence about how common it is. The survey supplies a wider comparison; the business’s own records establish which problem it should address.
The central finding is that reported website features come in different combinations, even among businesses already paying for online advertising. Reviewing the connection between product information and help is more useful than treating the presence of a catalog, a chat button or a service page as a complete answer on its own.
How we calculated the feature combinations
We analyzed the public confidentiality-treated TIC Empresas 2025 microdata from NIC.br/Cetic.br, retrieved October 17, 2026. The file contains 4,171 records. The collection report lists 4,174 completed interviews; the reason for the three-record difference is not established in the public documentation. Our calculations use the supplied public file.[1][3]
The survey covers active formal enterprises in the Cempre business register with 10 or more people working in selected manufacturing, construction, trade and service industries. Public enterprises and several other sectors are excluded. Fieldwork ran in three waves from February 2025 to January 2026. Advertising and website-feature questions refer to each interview’s preceding 12 months; website presence is asked as a current condition.[2][3]
The primary group requires yes to internet use (B1), website presence (B8) and paid internet advertising (B17A), leaving 1,353 records. Explicit nonadvertisers with websites contribute 1,129. Another 225 website respondents have unknown advertising status and are excluded from that yes/no comparison. Unknown feature answers remain in the applicable denominator but are not counted as either yes or no.[4]
Each estimate divides the sum of survey weights for the specified combination by the sum for its eligible group. We use the supplied design object and its 200 combined replicate weights to recalculate whole ratios, differences and size-standardized differences. Its stored variance settings center replicate deviations at their mean. The displayed 95% intervals use 1.96 standard errors, following Cetic’s method; they are pointwise intervals, not simultaneous guarantees for every comparison.[3][6]
For the catalog-with-neither combination, assigning unknown responses only where they could meet the definition changes the point estimate from 12.5% to an upper bound of 13.3%. That missing-response bound is separate from its sampling interval. We do not publish sparse size-by-feature results or cross size, region and industry into new demographic cells.
The collection report gives an overall response rate of 8%. Weights adjust for the survey design and nonresponse on its calibration dimensions, but do not eliminate every possible source of bias. Confidentiality treatment also means these are estimates from the public file, not access to original identified responses. Cetic checks the treated file against its published tables; that does not establish exact preservation of every new joint combination.[3][7]
All seven checked official margins of error reproduce to four decimal places. Six corresponding point estimates round to the published values; the advertising marginal differs by about 0.00005 percentage points at the final printed digit. This does not affect the one-decimal results here. Separate feature percentages are already published; our contribution is the stated respondent-level combinations and descriptive comparison, not a claim that website-function research is new.[5][6]
- Download the feature combinations and comparisons (CSV)
- Download the analysis code and source instructions (ZIP; English instructions)
The CSV contains aggregate estimates and pointwise 95% confidence intervals. Group percentages and percentage-point differences use different units, identified in each row. The analysis package provides code, source URLs and hashes; it does not include respondent microdata or identifiers. Numeric fields use a decimal point.
Sources and notes
- NIC.br/Cetic.br, TIC Empresas 2025, public microdata with statistical confidentiality treatment, version 1.0, published June 15, 2026. Retrieved October 17, 2026. Original weighted calculations by Influence IQ use this public respondent file, rather than subtracting separate published feature percentages.
- TIC Empresas 2025 questionnaire, printed pages 5–7: B8 asks about a website or internet page; B9 asks about features in the preceding 12 months; B17A asks about paid internet advertising in that period. B9 includes product/service catalogs, after-sales support or SAC, and chat supplied by a person, virtual agent or chatbot. The public dictionary maps these to B9_1, B9_5 and B9_11.
- TIC Empresas 2025 methodological report, printed pages 31–40, and companion collection report, printed pages 53–54. The methods define enterprise scope, people occupied, stratification, all-wave Module B, weighting and 95% margins. The collection report gives fieldwork periods, 4,174 completed interviews and an 8% total response rate. Both documents and source hashes are identified in the analysis package.
- Influence IQ calculations: restrict B1, B8 and B17A to explicit yes for the advertiser group; use B17A=no for its comparison group. Public codes are 0=no, 1=yes, 97=unknown, 98=no response and 99=not applicable. Unknown responses are not recoded as no. Size standardization uses the pooled registered-size distribution of website respondents with known advertising status, recalculated within every replicate.
- Cetic’s B7 table already reports website features separately, by published business categories. These marginal results establish prior coverage of individual features; they do not identify the specific combinations calculated for advertisers in this article. No claim of worldwide research priority is made.
- The supplied RData design object is a bootstrap svyrep.design with 200 combined replicate weights, scale 0.005901842120932432, replicate scales of 1 and mse=false. Variance is the scaled sum of squared deviations from the replicate mean. The survey package reference documents these settings. The producer’s package version and replicate-generation recipe are not established; calculations use the supplied object. These intervals do not quantify residual nonresponse bias or error introduced by confidentiality treatment.
- Cetic’s public enterprise microdata undergo confidentiality treatment, including generalization and suppression. Its utility checks concern the published tabulation plan. Original enterprise files require separate access arrangements and were not used. We publish aggregate results, code and source links, not respondent records or identifiers.
- The dataset-specific metadata assigns CC BY 4.0. Source: NIC.br/Cetic.br, TIC Empresas 2025. Calculations, interpretation and translations by Influence IQ; these adaptations are not endorsed by NIC.br/Cetic.br. The separate research book has different reuse terms; none of its charts or images is reproduced here.
Source: NIC.br/Cetic.br, TIC Empresas 2025. Calculations, interpretation and translations by Influence IQ. NIC.br/Cetic.br does not endorse these adaptations.