How many AI tools do people who switched tools use?
A new comparison of Stack Overflow survey responses shows how current tool counts differ between people who reported a past-year switch and those who did not.
An original analysis of paired answers in the voluntary 2026 Stack Overflow Developer Survey. Fieldwork: June 23–August 5, 2026.
Abstract
Among 7,774 respondents to Stack Overflow’s voluntary 2026 survey who reported switching AI tools for work in the past year and supplied a current weekly count, 87.4% reported at least two tools. Among 4,031 respondents who reported no switch and supplied a count, the share was 65.4%. Three or more tools were reported by 55.4% and 26.3%, respectively. Influence IQ calculated these comparisons by pairing answers within each response.[1]
The result describes current toolkits alongside switching history, not how those toolkits changed. For businesses marketing or evaluating an AI work tool, it supports asking what task a candidate should take over and what other tools would surround it. A fictional example shows how to make that conversation concrete. The survey counts intentional use of AI-enabled products and interfaces, including embedded AI capabilities; it does not measure subscriptions, costs or an ideal number of tools.
A prospective customer says they have been trying another AI tool. The demonstration is booked, and the sales team prepares to show why its product is better. One practical detail may remain unanswered: what work is the customer proposing to change, and what will continue around it?
For someone drafting posts, editing videos or preparing technical content, an AI tool can be one part of a wider routine. Replacing a drafting assistant need not replace an editor, an internal tool or a different assistant used for another task. A conversation about switching can therefore leave the rest of the proposed arrangement unclear.
We looked at that context through two questions in the 2026 Stack Overflow Developer Survey. One asks about a switch during the past year. The other asks how many AI tools or AI-enabled products the person intentionally uses for work in a typical week. Together, the answers let us compare the toolkits reported by people who changed tools with those who did not.
A proposed change sits inside a working routine

Two tools is the most common answer in both groups
Two tools was the single most common answer among people who reported a switch and among those who reported no switch. That shared answer does not make the distributions alike. The important difference appears when we look at how respondents spread across the other counts.
Among the 7,774 respondents who reported switching and supplied a count, 957 reported one tool, or 12.3%. Among the 4,031 who reported no switch and supplied a count, 1,357 reported one, or 33.7%. The one-tool answer was therefore much more common in the no-switch group. Both percentages use the people in their own group who answered the count question.[1]
The comparison runs the other way at three or more tools: 4,303 of the switch group, or 55.4%, compared with 1,059 of the no-switch group, or 26.3%. A business hearing that someone changed AI tools should not assume the person now works through a single product. Equally, someone who reports no switch may use several products: 65.4% of that group reported at least two.
The table keeps the whole distribution visible. The difference is not confined to a few extraordinary answers at the top. Three, four and five tools each account for a larger share of the switch group. We also retain the zero answers. A person can have switched tools during the past year and report using none in a typical week when answering the survey.
These are different respondents, observed through one survey. We have not watched one group acquire more tools than the other, matched otherwise similar users, or established why the groups differ. More extensive use might accompany more opportunities to try another tool, for example, but that explanation was not tested. The finding is the difference between the reported distributions, with the question periods kept in view.
Weekly AI-tool counts differ between the two groups
Respondents reporting a past-year work-tool switch: 7,774 count answers. Respondents reporting no switch: 4,031 count answers. Each percentage uses its own group’s count-answer base.
| AI tools used in a typical workweek | Reported switching: count | Reported switching: share | Reported no switch: count | Reported no switch: share |
|---|---|---|---|---|
| 0 tools | 23 | 0.3% | 37 | 0.9% |
| 1 tool | 957 | 12.3% | 1,357 | 33.7% |
| 2 tools | 2,491 | 32.0% | 1,578 | 39.1% |
| 3 tools | 2,154 | 27.7% | 709 | 17.6% |
| 4 tools | 932 | 12.0% | 167 | 4.1% |
| 5 tools | 698 | 9.0% | 139 | 3.4% |
| 6–10 tools | 408 | 5.2% | 37 | 0.9% |
| 11+ tools | 111 | 1.4% | 7 | 0.2% |
Count the AI capabilities people knowingly use
The source question is broader than a list of chatbot subscriptions. It asks about distinct AI tools or AI-enabled products that someone intentionally uses for work in a typical week. A general chat assistant can count, but so can AI search, a coding assistant, an internal company tool or an AI capability built into workplace software.[2]
Consider a creator who uses a chat assistant to prepare draft copy and deliberately uses AI caption features in a video editor. Those are two AI-enabled products under this definition, even if the creator thinks of the second one mainly as an editing application. An AI feature running in the background without the person knowingly using it does not belong in the count.
The boundary also works within a product. Selecting several models inside the same product usually counts as one tool. The question allows them to count separately when the person accesses them through separate tools or interfaces. The unit is therefore the deliberately used product or interface, rather than the number of models behind it.
This matters when a marketer asks about an “AI stack.” One person may answer with paid accounts, another with applications, and another with model names. Briefly explaining what you mean makes the answer easier to use. It also prevents an unsupported leap from a high tool count to a high bill: this question does not measure prices, subscriptions, redundant spending or whether the respondent considers the number excessive.
The same present count can follow different changes
The next two histories are fictional. They show how two people could give the same answers without making the same change to their work. Neither history is a respondent account or a result recovered from the survey.
In the first, a content producer begins the year using three AI-enabled products: a drafting assistant, an interview-summary tool and caption features in a video editor. She replaces the drafting assistant with another one and continues the other two tasks in their existing products. Asked later about a typical week, she reports three tools. Asked whether she switched during the past year, she answers yes.
In the second, another producer begins with a drafting assistant and the video editor. He replaces the drafting assistant, then starts using a separate summary tool for a new interview project. He also reports three tools and a past-year switch. The present count and switch answer are identical to the first producer’s, but his number of tools changed while hers did not.
The survey gives us those two answers without the histories needed to distinguish them. A third possible history could involve retiring several products and ending at three. Nothing in the measured count tells us which path a particular person took, or whether an older product remains available but unused.
For an AI-product marketer, that is a reason to ask a more specific follow-up before choosing the demonstration. “What do you want this tool to do differently?” and “Which other work tools need to fit around that change?” invite information that the survey cannot supply. The responses might lead to a narrow replacement trial, a new task, or a decision to keep the current arrangement. Those are possible customer decisions, not outcomes predicted by our percentages.
A content studio keeps the demonstration focused
Now imagine a fictional two-person studio evaluating a new writing assistant for its client work. The studio already uses a general chat assistant for initial copy, an AI summary tool for approved interview notes and AI caption features in its video editor. The candidate is being considered for initial copy. The studio is not proposing to replace every AI capability it uses.
The studio chooses a concrete task for the demonstration: draft three social posts for a client’s product launch from an approved factual brief and a small set of brand-language examples. The brief names the offer, the audience and the facts the posts may use. The same approved inputs go to the current drafting tool and the candidate. This is an illustrative trial plan; the article supplies no observed outputs or performance scores.
The summary tool’s output is prepared and checked before this comparison begins. That keeps a change in the source material from being confused with a change in the writing tool. The studio also leaves the video editor in place. If a draft will become a video caption, the team checks how the proposed wording reaches the editor and whether the person preparing the video has what they need.
One teammate reviews the drafts against the approved facts and language examples. The other follows a chosen draft through the usual preparation steps. They record what they actually have to correct or move, rather than assuming that a polished answer in the candidate’s own interface means the job is finished. Product-specific imports, exports and connections need to be tried as part of that handoff.
The trial note can stay short: “We are evaluating this candidate for initial post drafts. The approved summary is its input. Reviewed copy must reach the person preparing each post or video. Our existing summary and editing tools remain in this proposed arrangement. Before deciding, we need to see whether the candidate can complete this task with our approved material.”
If the trial reveals that the studio actually wants a different task, it can change the proposal explicitly instead of treating the original demo as evidence for that wider job. If the current tool already meets the task’s requirements, keeping it is a possible decision. Understanding the surrounding toolkit helps the marketer keep the demonstration focused on the work the customer actually wants to change.
Ask about the proposed change before expanding the pitch
The most useful follow-up to this study is a small addition to a real conversation. Ask the person to name the task they want to change, the product or process doing it now, and the next person or tool that needs the result. Then ask what would have to be demonstrated before they would choose the candidate for that task.
For the fictional studio, “better writing” is too broad to guide the demonstration by itself. Drafting three launch posts from an approved brief names the work. Identifying the teammate and editing tool that receive the copy names where the result must go. A demonstration can then address that proposed change without promising to replace the rest of the studio’s toolkit.
This is practical advice drawn from the measurement boundary and the observed multi-tool context. It is not a tested method for increasing adoption, reducing costs or improving retention. The percentage of respondents reporting several tools cannot tell a vendor which connection to build or which customer will buy.
The surrounding decisions deserve their own questions. Who evaluates and who decides is the subject of our software-purchasing study. Who develops and maintains an AI system belongs in the build-versus-buy discussion. What benefit a team wants to examine is covered in our analysis of reported generative AI benefits. Keep those questions separate from the current one: what role is this candidate being asked to play?
Follow one task from its brief to review
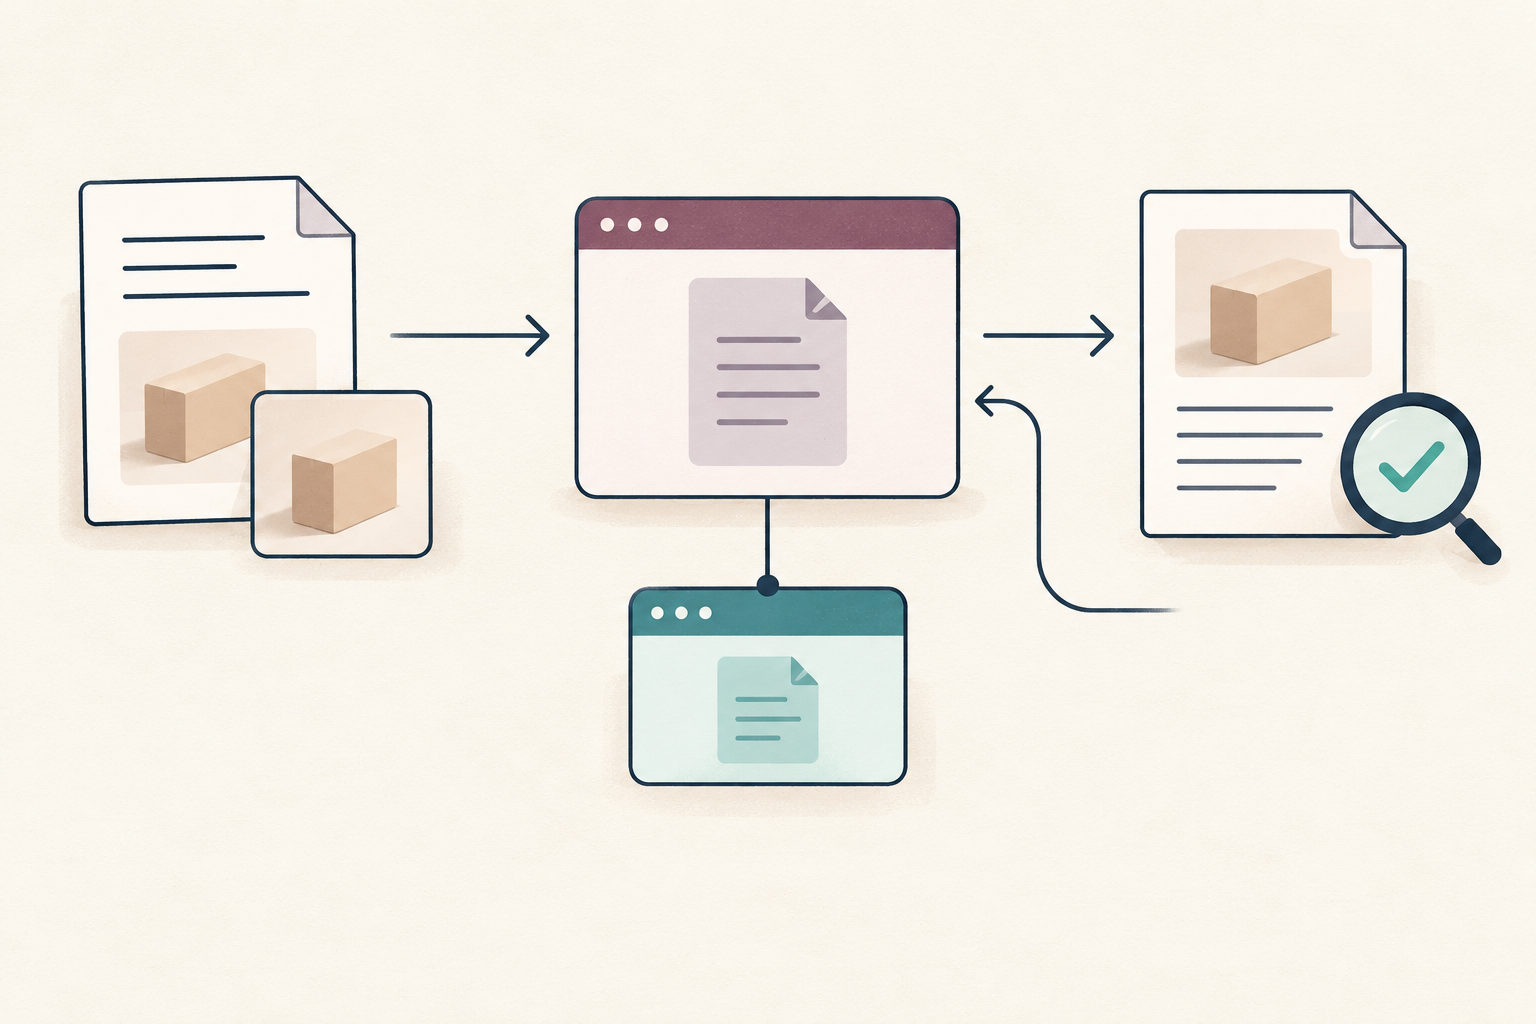
Start with approved inputs
Give the current tool and candidate the same brief and source material.
Try the candidate in its proposed role
Evaluate the initial-copy task while identifying the other tools that remain.
Review the handoff
Follow the output to its next person or tool and record any revisions needed.
No sign-up required. The package includes exact counts, checks and the fictional demonstration note. Technical reproduction instructions are in English. The source survey is attributed and licensed as described in the sources and package.[5]
How we paired the answers
Influence IQ analyzed the released public responses to Stack Overflow’s 2026 Developer Survey. The published cohort contains 30,903 responses, with fieldwork from June 23 to August 5, 2026. Recruitment through Stack Overflow’s sites and an opt-in email list makes this a voluntary respondent sample. We report its answers without treating them as population estimates for all developers, businesses or creators.[4]
We paired the optional weekly tool-count question with the optional past-year switching question inside each response. Every stated yes reason joins the switch group; the exact no answer joins the no-switch group. The explicit not-applicable answer and a missing switching answer do not enter either comparison group. Both questions share the survey’s AI-use route.[2][3]
Of 8,637 people reporting a switch, 7,774 supplied a count and 863 did not. Of 4,423 reporting no switch, 4,031 supplied a count and 392 did not. The missing shares are 10.0% and 8.9%, respectively. Each displayed percentage divides a bin’s count by the number of count answers in its own group. Missing counts are not zero.
Every nonmissing count entry could be read as a whole number of zero or more. The main table retains zero and large answers, grouping every value above ten into 11+. Of the 11,919 people who supplied a count overall, 24 gave a number above 100, including 22 in the switch group. Excluding values above 100 leaves the two-or-more shares at 87.4% and 65.4%. Restricting to positive counts gives 87.7% and 66.0%. These checks do not turn self-reports into observed software usage.[1]
Stack Overflow already publishes separate charts for tool counts and switching reasons. Our contribution is the paired distribution, with full counts, definitions and checks available in the download. The analysis is descriptive. It supplies a more specific starting point for a conversation about a proposed tool change, while leaving the person’s actual tasks, history and evaluation decision to that conversation.[2][3]
Sources and notes
- Influence IQ analysis of the pinned public 2026 Stack Overflow Developer Survey export, commit 6c646551e86ffcafca0ac04f1dfb17a2558ec23d. The main comparison pairs 7,774 yes-switch answers with counts and 4,031 no-switch answers with counts. Counts and percentages are unweighted; percentages are rounded to one decimal. The package contains the full bin distributions, missingness, source definitions and sensitivity checks.
- Stack Exchange Inc. (2026), AI tool count, Stack Overflow Developer Survey. This optional question counts distinct AI tools or AI-enabled products intentionally used for work in a typical week. Its official page already publishes the overall count distribution; our comparison adds switching status.
- Stack Exchange Inc. (2026), Did you switch AI tools in the past year?, Stack Overflow Developer Survey. The optional single-choice question asks whether the respondent switched for work and, if so, one primary reason. It does not give previous counts, replacement histories or all reasons a person considered.
- Stack Overflow Developer Survey 2026 methodology. The released cohort contains 30,903 responses from fieldwork dated June 23 to August 5, 2026. Promotion through Stack Overflow properties and an opt-in email list does not create a representative sample of all businesses, creators or developers.
- Contains information from the Stack Overflow Developer Survey, Stack Exchange Inc., available under the Open Database License (ODbL) 1.0. Individual contents are available under the Database Contents License (DbCL) 1.0. Source attribution, license links and reproduction details are included in the analysis package.
All ten language editions describe the same voluntary Stack Overflow survey responses. Translation does not turn these results into country-specific estimates.