Multivariate testing: what your creative test can tell you
Changing a headline and an image together can help you choose a finished creative. Learning about each element takes a different comparison. Historical Upworthy designs show how much can remain possible even when some combinations are absent.
Influence IQ analysis of the Upworthy Research Archive’s exploratory subset, covering website experiments from early 2013 to April 2015. The main comparison contains 188 eligible tests that varied both headline text and image IDs. This is a design inventory, not an analysis of clicks or campaign performance.
Abstract
An incomplete multivariate design can still preserve separate headline or image comparisons. Among 188 eligible Upworthy tests that varied both headline text and image IDs, 31 contained every combination. Of the other 157, 150 contained at least one comparison that held either the headline or image fixed; 75 contained both kinds. These counts describe the combinations present, not whether the tests produced reliable or useful performance results. [1]
The study uses a historical exploratory subset of website experiments from early 2013 to April 2015, holds excerpt text constant and excludes a documented period of possible assignment problems from its main scope. Including that period gives the same broad lesson: 180 of 199 incomplete designs retain at least one such comparison. For businesses and creators, the practical choice is to match the combinations to the question: choosing a whole creative, comparing one element, or examining how two elements work together.
Your team has two versions of a campaign ready. One pairs a product image with a direct headline; the other uses a different image and a more conversational headline. If one performs better, what will you have learned?
A well-run comparison can help you choose between those finished versions. It does not, by itself, show which change made the difference. Multivariate testing varies more than one element across a set of combinations. The useful starting question is what you want those combinations to help you decide.
The number of versions alone does not answer that question. Four headline versions paired with one image let the team compare headlines in that setting. Two headlines paired with two images also give four packages when every pairing is included, but they allow different comparisons. Writing down the pairings makes the distinction visible before the test begins.
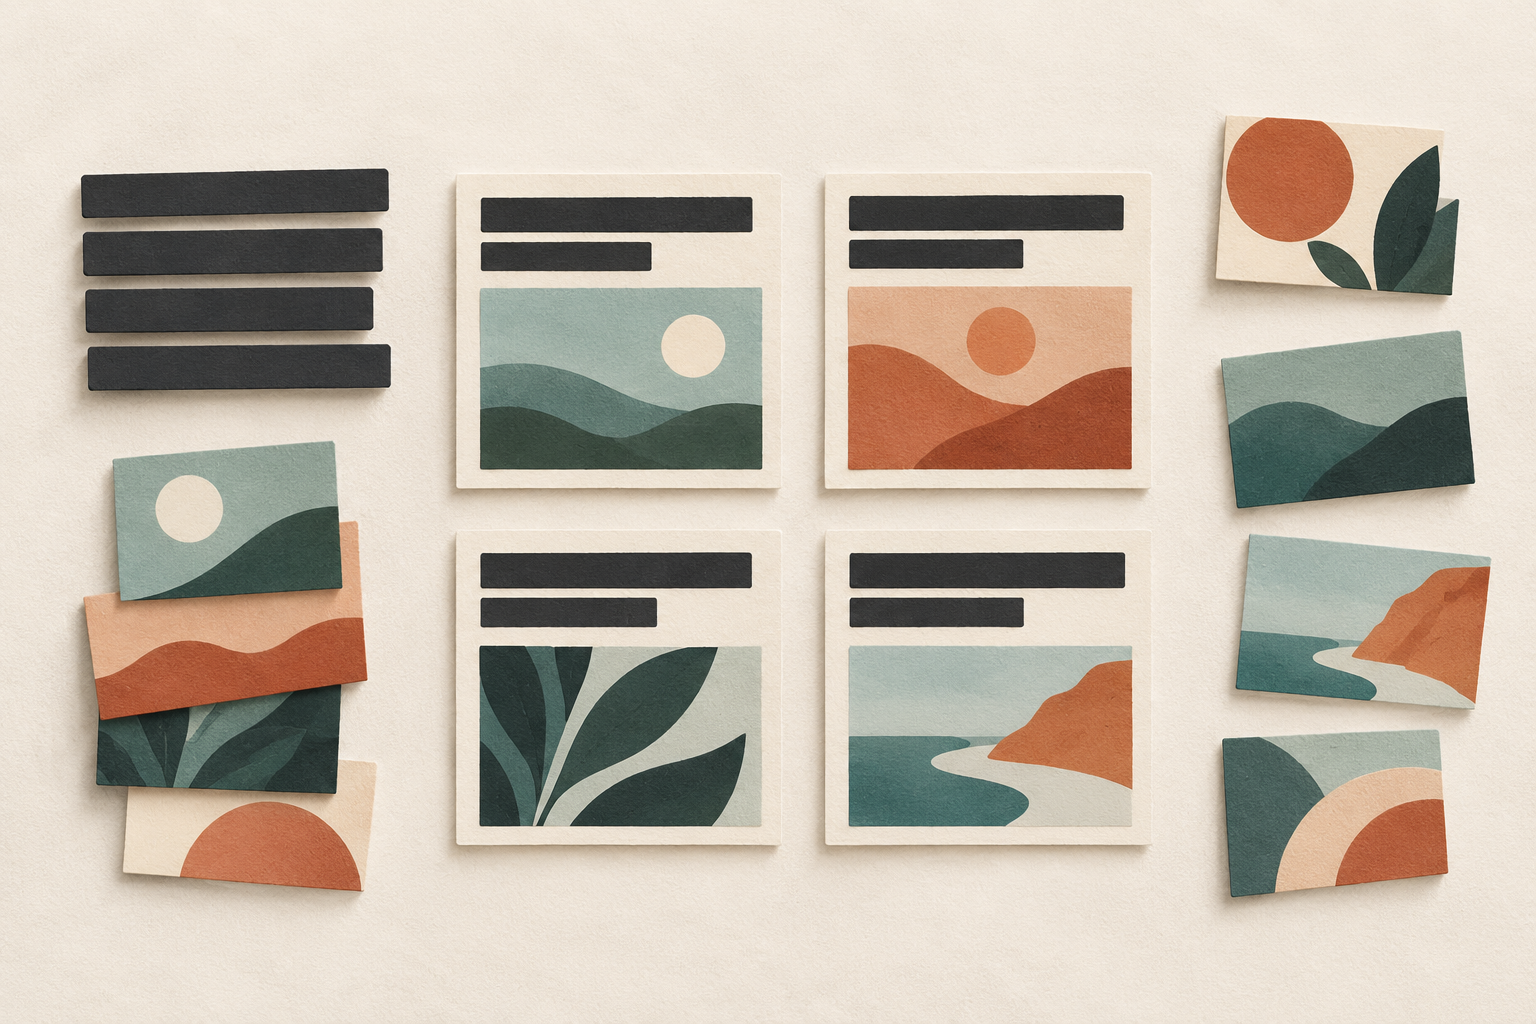
A finished creative contains several choices
Incomplete designs often kept a useful comparison
We examined the headline and image combinations within individual Upworthy website tests. From 3,212 tests meeting the main scope rules, 188 varied both elements. Most of the remaining tests varied only one of them. We kept each test separate and counted each once, regardless of how many people might have seen it. [2]
Only 31 of the 188 contained every combination of their observed headlines and image IDs. The other 157 were incomplete grids. That sounds restrictive until you ask what comparisons remained inside those grids. Of those 157 designs, 75 had both a same-image headline comparison and a same-headline image comparison. Another 30 had only the first kind, and 45 had only the second. Seven had neither.
Taken together, 150 of the 157 incomplete designs, or 95.5%, preserved at least one way to compare an element while holding the other fixed. This does not prove that any comparison had enough traffic, sound assignment or a meaningful result. It does show why “not every combination was tested” is too broad a reason to dismiss a design.
The table places complete and incomplete designs together. Across all 188, 106 contained both comparison types, 30 only headline comparisons, 45 only image comparisons and seven neither. “Both” means at least one of each. It does not mean that every headline or image can be compared on equal terms.
The original archive paper already explains that editors often chose packages without testing every possible combination. Our contribution is this inventory of the comparisons those choices left available. We cannot reconstruct each editor’s objective or judge whether a design met it. [1]
Most designs changing both elements preserved a component comparison
188 eligible historical Upworthy tests varying headline text and image IDs, with constant excerpt text and the specified date restriction. Each test has equal weight.
| Comparisons present in the design | Tests | Share of 188 tests |
|---|---|---|
| Headline and image comparisons | 106 | 56.4% |
| Headline comparison only | 30 | 16.0% |
| Image comparison only | 45 | 23.9% |
| Neither component comparison | 7 | 3.7% |
Three designs answer different questions
Imagine a pottery studio promoting a weekend workshop. It has two headlines: A, “Make your first ceramic bowl,” and B, “Spend Saturday at the pottery wheel.” Image 1 shows a finished bowl; Image 2 shows the wheel. These are illustrative choices, not Upworthy examples or measured campaign results. Keep the offer and other displayed copy the same while considering three possible designs.
First, the complete grid contains A with Image 1, A with Image 2, B with Image 1 and B with Image 2. The team can compare the headlines while holding Image 1 fixed, then make the same headline comparison with Image 2. It can also compare the images under each headline. Four cells provide these opportunities; they do not establish how much evidence will be collected in each cell.
Second, the partial grid contains A with Image 1, B with Image 1 and B with Image 2. A with Image 2 is absent. The team can compare A and B with Image 1 held fixed. It can separately compare the images while holding headline B fixed. The missing cell does not erase those two comparisons.
But the partial grid leaves another question unanswered by a direct four-cell comparison: would the A-versus-B difference look the same with Image 2? There is no A-with-Image-2 result to use. Nor can the team identify the best of all four possible packages just by choosing among the three it observed. The untested package could behave differently.
Third, the diagonal design contains only A with Image 1 and B with Image 2. Neither element stays fixed between the two packages. A valid test could still support choosing between those two finished versions. It would not separately identify a headline contribution or an image contribution from that comparison alone.
There is no universal winner among these designs. If the studio must choose between two approved concepts for a specific launch, comparing the packages may fit its task. If it wants to reuse a headline across images, it needs evidence relevant to that broader choice. Additional combinations earn their place by answering a question the team actually has. [3]
Three illustrative designs include different combinations
A fictional pottery-studio example with two headlines, A and B, and two images, 1 and 2. These cells are design illustrations, not observations from the archive.
| Headline and image combination | Complete grid | Partial grid | Diagonal design |
|---|---|---|---|
| Headline A + Image 1 | 1 | 1 | 1 |
| Headline A + Image 2 | 1 | 0 | 0 |
| Headline B + Image 1 | 1 | 1 | 0 |
| Headline B + Image 2 | 1 | 1 | 1 |
A comparison in each direction is not a complete two-by-two test
The archive makes this distinction concrete. Of the 106 designs containing both comparison types, 74 did not contain even one complete two-headline, two-image rectangle. A design can therefore offer a headline comparison somewhere and an image comparison somewhere else without supplying the four cells needed for a direct comparison of their differences.
Consider the studio’s partial grid again. Comparing A and B with Image 1 asks one question. Comparing Image 1 and Image 2 under B asks another. Neither tells us whether the headline difference itself changes when the image changes. That third question is about an interaction: whether the relationship between one element and the response depends on the other element.
In the 188-design set, 32 contained at least one complete rectangle. That includes all 31 complete grids and one larger incomplete grid. Having such a rectangle supplies a place to form a direct interaction contrast. It does not show that an interaction exists, and it is not the only possible basis for studying interactions under other designs or modeling assumptions.
For a campaign team, the distinction belongs in the brief before it belongs in a statistical model. “Compare these two headlines with this image” is a narrower request than “find a headline that works across our images.” A result answering the first question should not quietly become the answer to the second.
The broader date range gives the same planning lesson
The main inventory excludes tests whose creation-date span touches June 25, 2013 through January 10, 2014. Archive researchers identified possible assignment problems during that period. Those concerns matter for cause-and-effect research; they do not make the combination records unusable for a structural inventory. We therefore also repeated the comparison with that period included. [4]
The broader scope contains 239 tests varying both elements. Forty contain every combination, while 199 are incomplete. Among those incomplete designs, 180, or 90.5%, retain at least one comparison holding one element fixed, and 93, or 46.7%, retain both kinds. The corresponding main-scope figures are 95.5% and 47.8%. The exact shares move, but incomplete designs still commonly preserve a specific comparison.
We also checked a text-handling choice. The main analysis compares headline and excerpt strings exactly. Removing boundary whitespace and collapsing repeated whitespace produces 189 both-varying tests, with 31 complete grids, 108 containing both comparison types and 32 containing a complete rectangle. This check changes which designs qualify, so its counts are shown with their own denominator. [5]
Median coverage is 50% in all three scopes. Coverage is the number of observed headline-image combinations divided by the number possible using that test’s observed headlines and image IDs. The median is a description, not a quality score. A missing combination may have been irrelevant, unsuitable or outside the editor’s intended comparison; the archive does not settle why it was omitted.
Changing the scope retains the distinction between coverage and comparisons
All columns count tests, with each row using its own both-varying denominator. The text-handling check keeps the main date restriction; the all-period check keeps exact text handling.
| Analysis scope | Tests changing both elements | Complete grids | Both comparison types | At least one complete 2×2 |
|---|---|---|---|---|
| Main scope: exact text, date restriction | 188 | 31 | 106 | 32 |
| Whitespace-normalized text, date restriction | 189 | 31 | 108 | 32 |
| Exact text, all periods included | 239 | 40 | 133 | 42 |
Write the next test brief around the decision
For the pottery studio, start by deciding what will happen after the test. Will the team choose one finished workshop promotion, keep one image and revise its headline, or carry a headline into several future designs? Each decision calls for a different set of comparisons. A larger grid is not automatically a better use of the team’s effort.
If the decision concerns finished packages, list those packages without promising an explanation of each component. If the decision concerns a headline, identify the image that will stay fixed. If the team needs to examine whether a headline difference changes across two images, include the relevant four combinations or obtain a justified alternative design. Keep this separate from deciding the response measure, allocation and observation period.
Check whether the proposed combinations make sense before adding them. An offer-specific headline may belong with only one product image. Creating an unsuitable pairing simply to fill a grid would change the task. The team can instead narrow the question or develop versions that can sensibly be paired. A complete grid is useful when its comparisons serve the decision, not because a filled table looks more thorough.
Use the following fields as a short planning brief. The bracketed text is for your own campaign, not a finding from this study.
Decision after the test: [choose a finished package; compare a named element in a specified setting; examine a specified combination of elements].
Elements and versions: [exact headline texts; image files or stable IDs; any other changing content].
Included packages: [the headline-image pairs that will actually be shown].
Comparisons needed: [which pairs hold an element fixed; which four cells support the interaction question, if relevant].
Evidence plan: [response measure; audience and assignment; exposure conditions; planned observation and review rule].
Conclusion boundary: [what the design could support; which untested combinations or settings remain outside the decision].
For example, a studio using the three-cell partial design can write: “We will compare the headlines with Image 1 and compare the images with headline B. We are not testing headline A with Image 2.” That sentence keeps two useful questions and the missing comparison visible without declaring the design inadequate.
A creator preparing work for a client can use the same distinction when discussing a revised thumbnail and title. The question is which version or element the client wants to choose. Our counts come from a publisher’s website, however, and do not establish how a current social platform assigns or measures creative variants.
Keep the question beside the combinations
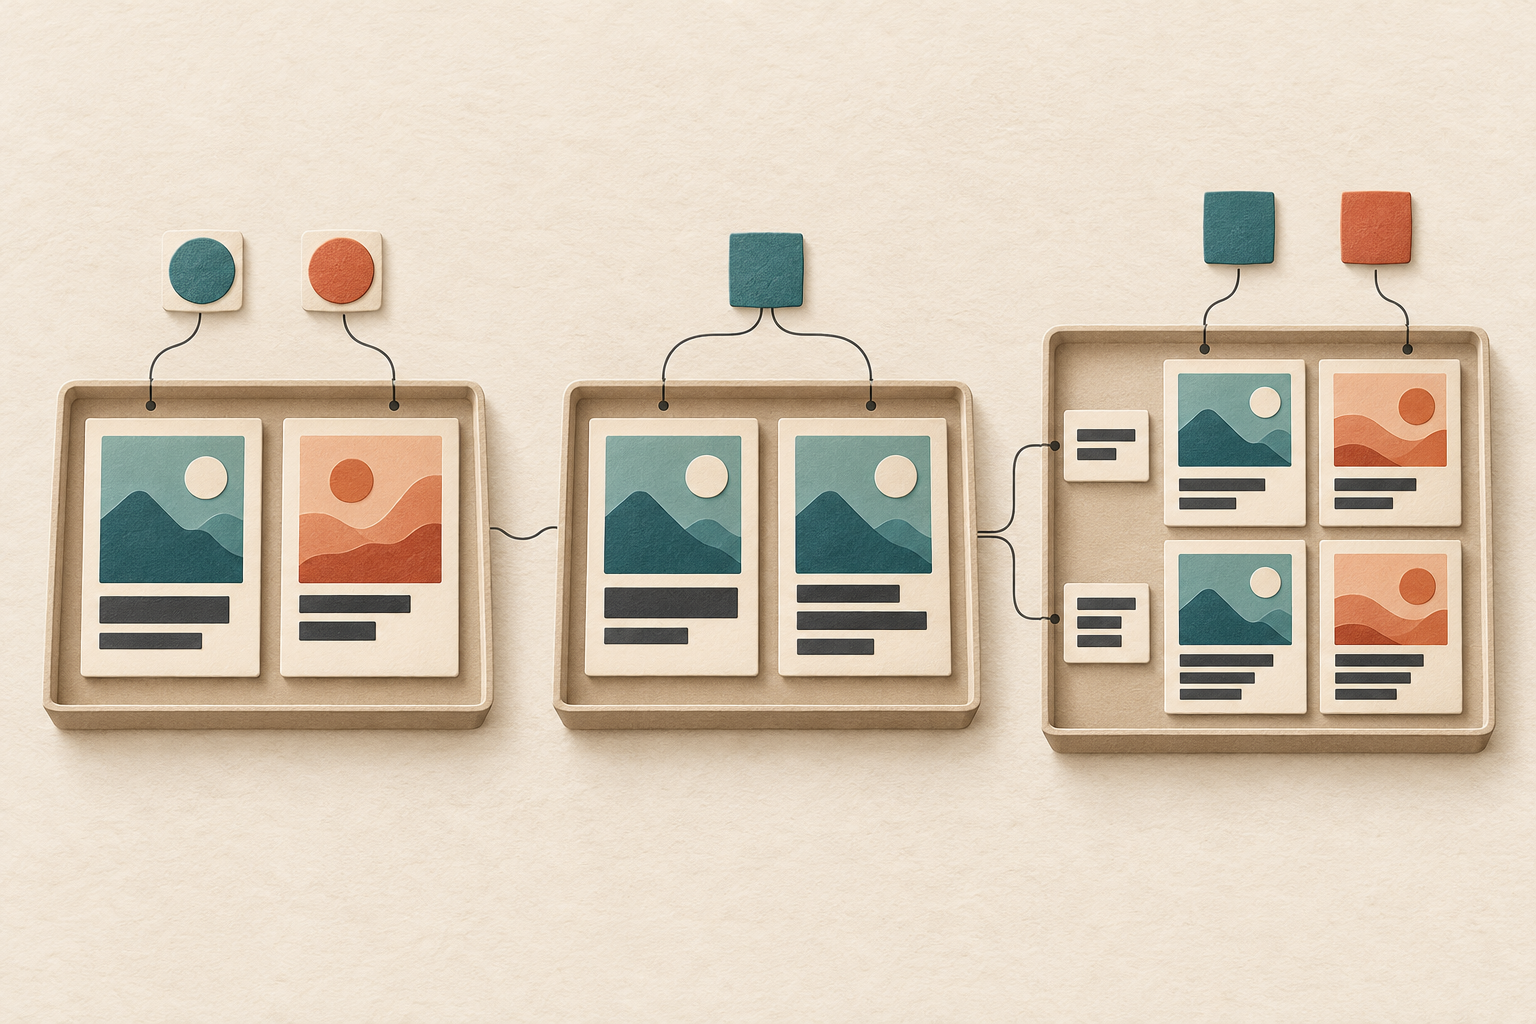
Choose a finished creative
Compare the packages that are candidates for the decision.
Compare one element
Keep the other element fixed in the comparison you need.
Examine the pairing
Include the combinations needed to ask whether a headline difference changes across images.
How the design inventory was built
The source is the publicly released exploratory file of the Upworthy Research Archive, described by J. Nathan Matias, Kevin Munger, Marianne Aubin Le Quere and Charles Ebersole. It contains 22,666 package rows grouped into 4,873 tests from the historical 2013–2015 archive. We used the headline, image identifier, excerpt, test identifier, creation timestamp and archive row index. Clicks, impressions and editorial selections were not used. [1] [6]
A structural feasibility check preceded the final design-audit plan and informed its question. The audit is therefore an exploratory reanalysis, not a preregistered confirmatory study. The specified rules retain tests with usable structural fields, apply the main date restriction, and require identical excerpt text across their packages. The excerpt restriction is conservative because the paper and archive documentation disagree about whether that field was displayed. [6]
The selection table shows successive exclusions, followed by a breakdown of the eligible tests. Five tests lack a headline or image ID; 1,050 then fail the date-scope rule and 606 have varying excerpts. The 3,212 retained tests include 1,624 varying only headlines, 1,078 varying only image IDs, 188 varying both and 322 with a single observed combination. The last category can still contain multiple source rows.
Within a test, repeated identical headline-image pairs count once as design cells. Five of the 188 both-varying tests contain repeated cells. A complete grid contains every pairing of the headline strings and image IDs observed in that test. Different strings need not express different ideas, and different image IDs need not represent visibly different pictures; the image files are unavailable.
The results count designs equally, not people, impressions or businesses. They do not establish present-day marketing practice, performance or statistical power. The downloads provide the aggregate results and reproduction method, including both scope checks, so readers can inspect the distinction between an observed combination and a conclusion drawn from it. [7]
The main comparison begins with 188 of 3,212 eligible tests
Selection from the 4,873 tests in the public exploratory file. Exclusions apply in the order shown. The four final design categories partition the 3,212 eligible tests.
View the selection stages and all eligible categories
| Selection stage or eligible design category | Tests |
|---|---|
| Starting exploratory tests | 4,873 |
| Excluded: missing headline or image ID | 5 |
| Excluded: specified creation-date interval | 1,050 |
| Excluded next: varying excerpt text | 606 |
| Eligible after exclusions | 3,212 |
| Eligible: headline varies, image fixed | 1,624 |
| Eligible: image varies, headline fixed | 1,078 |
| Eligible: headline and image both vary | 188 |
| Eligible: one observed combination | 322 |
- Download the figure values and scope labels (CSV)
- Download results, structural test records and analysis code (ZIP; English instructions)
The CSV includes 41 values from the four figures, with illustrative design cells labeled separately from observed counts and shares. The ZIP contains aggregate results, structural test records and analysis code. Reproduction instructions are in English; download the original public archive separately. No click or impression outcomes are included.
Sources and notes
- Matias, J. Nathan; Munger, Kevin; Aubin Le Quere, Marianne; and Ebersole, Charles (2021), The Upworthy Research Archive, a time series of 32,487 experiments in U.S. media, Scientific Data 8, 195. DOI: 10.1038/s41597-021-00934-7. Influence IQ’s analysis uses the exploratory subset and the corrected source description. The original paper qualitatively explains that editors often did not test all headline-image combinations.
- Main both-varying denominator: 188 tests. Complete grids: 31; incomplete: 157. The incomplete group contains 75 with both comparison types, 30 with headline comparisons only, 45 with image comparisons only and 7 with neither. Thus 150/157 = 95.5% retain at least one type. “Comparison” identifies a structural opportunity, not an estimated effect or verified valid experiment.
- The three studio designs are illustrative. A full two-factor, two-level design contains all four combinations. The partial example omits A with Image 2; the diagonal example retains only A with Image 1 and B with Image 2. A four-cell design alone does not establish assignment quality, adequate sample size or a meaningful interaction. NIST’s handbook explains full factorial designs and their combinations.
- The archive’s June 2024 correction identifies possible randomization problems from June 25, 2013 through January 10, 2014 and discourages causal research using that period. It explicitly preserves other research uses. Our main analysis excludes any test whose creation-date span intersects the interval; timestamps do not prove exposure dates and their timezone is unknown. The all-period structural check retains those records.
- Whitespace sensitivity strips leading/trailing whitespace and collapses internal whitespace in headline and excerpt text, preserving case and punctuation. Eight tests become eligible; one shared eligible test changes structural classification. Denominators are recalculated rather than held at 188. Main, whitespace and all-period scopes contain 188, 189 and 239 both-varying tests respectively.
- The pinned exploratory CSV is upworthy-archive-exploratory-packages-03.12.2020.csv, OSF file version 1, 14,260,949 bytes. Its SHA-256 is 8368313b060f4015a0c6fb34e6d788163cee29554144aba9390b14922eb9d8ce. The file has no updated problem flag, so the date restriction is derived separately. The paper describes excerpt text as displayed; the archive documentation lists it among fields not believed to have been displayed. Holding excerpt constant avoids attributing differences across that disputed field.
- Cornell University publishes the Upworthy Research Archive, associated code and documentation under Creative Commons Attribution 4.0 International. Influence IQ supplies this derived structural analysis; no endorsement by Upworthy or the archive authors is implied. The analysis package contains aggregate outputs, structural test records, code and English reproduction instructions. Obtain the original public data separately from the archive.
This English article is the source edition. Every language edition describes the same historical Upworthy exploratory subset and the same illustrative designs. Translation does not make the findings a local-market or current-platform benchmark.