Airbnb amenities: what similar listings offer in three cities
A dedicated workspace in London and washer access in Austin tell different stories about the surrounding listing mix. Here is how hosts can use that context when deciding what to photograph and explain.
An analysis of listing details captured in September 2026.
Abstract
The same Airbnb amenities are not equally common together in every city. We analyzed one-bedroom entire-home listings with a maximum capacity of two guests in September 2026 Inside Airbnb files. Wi-Fi, a dedicated workspace, a kitchen and washer access appeared together in 39.7% of the analyzed Austin listings, 35.6% in London and 61.2% in Bangkok. Among listings recording the other three features, a workspace was recorded in 44.4% in London; washer access was recorded in 73.4% in Austin. Those combinations differed substantially from the corresponding groups in the other cities.
These are captured listing details, not inspections of properties or measurements of guest demand. For hosts whose places match this scope, the findings offer context for choosing which genuine features to show clearly in photos and captions. They do not identify which amenities increase bookings.
A host preparing new photos has a practical choice: which features need their own photograph, and what should each caption explain beyond the amenity name?
The same four boxes can describe a common combination in one city and a less common one elsewhere. Even cities with similar all-four shares can have different combinations. Airbnb’s hosting guidance encourages accurate amenity details and updated photos.[3] Our analysis adds local context for deciding which genuine features deserve a fuller explanation.
We compared Austin, London and Bangkok using a consistent property scope: an entire place, one bedroom and a listed maximum of two guests. After excluding unusable amenity lists, the analysis contained 1,273 listing IDs in Austin, 15,086 in London and 11,257 in Bangkok. The underlying details were captured on September 19–20, September 18–23 and September 23–26, 2026, respectively.[1]
The distinction throughout this article is between an amenity recorded in the captured list and one not recorded there. An omitted workspace label does not prove that a home has nowhere to work. These records describe how listings were represented, which is useful context for a host reviewing their own description and photos.
Four features, one place to describe
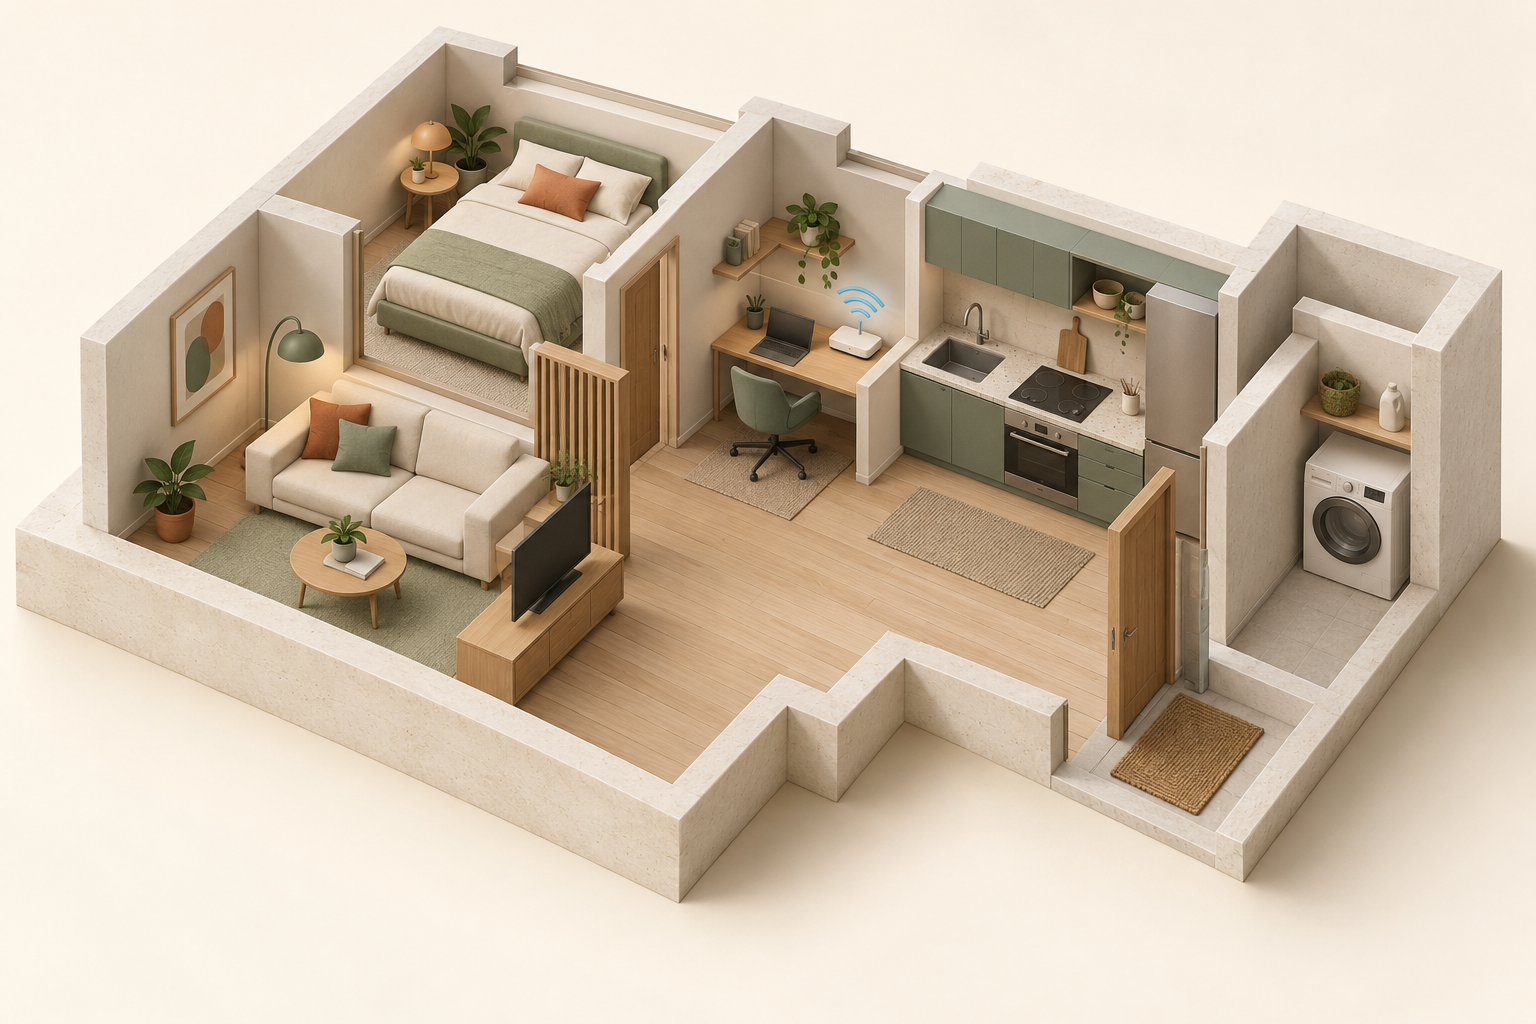
- Wi-Fi
- Dedicated workspace
- Kitchen
- Washer access
The individual amenities are familiar; their combinations differ
Wi-Fi was recorded in more than 96% of the analyzed listings in each city. Kitchens were also common, ranging from 83.2% in Austin to 90.9% in London. Dedicated workspaces and washer access varied more.
How often each amenity was recorded
Wi-Fi was widely listed. The four-feature combination was less common and varied between cities.
| Recorded feature | Austin | London | Bangkok |
|---|---|---|---|
| Wi-Fi | 99.3% | 96.7% | 96.5% |
| Dedicated workspace | 63.6% | 45.0% | 72.1% |
| Kitchen | 83.2% | 90.9% | 88.3% |
| Washer access | 65.0% | 84.9% | 91.5% |
| All four together | 39.7% | 35.6% | 61.2% |
The all-four row counts listings recording every feature together: 6,888 in Bangkok, 506 in Austin and 5,371 in London.
That makes a four-amenity claim fairly ordinary within the captured Bangkok group: 61.2% recorded the complete combination. A host can still explain it clearly. But the mere presence of all four would not support describing that combination as unusual in this group.
Austin and London look closer on the all-four measure, at 39.7% and 35.6%. The more interesting difference appears when we examine which features sit together.
In London, the workspace changes the picture
London's largest recorded combination was Wi-Fi, kitchen and washer access, without a dedicated-workspace label. It accounted for 6,728 listings, or 44.6% of the analyzed London group. Another 5,371 listings, or 35.6%, recorded all four.
To make the workspace comparison more specific, consider only listings already recording Wi-Fi, kitchen and washer access. There were 12,099 in London. Of those, 5,371 also recorded a dedicated workspace: 44.4%. The equivalent shares were 66.4% in Austin and 75.1% in Bangkok.
The comparison holds the other three recorded features constant. It does not match properties on location, price or quality.
For a London host who genuinely offers all four, the result gives a concrete reason to explain the workspace rather than let it disappear inside a general amenity list. A photograph can show where the desk is, what seating is provided and how the work area fits into the room. The caption can describe those visible facts.
A workspace label does not establish quiet, comfort or suitability for a particular job. The research identifies a less commonly recorded detail within this combination, without measuring how much a guest values it.
When three amenities are recorded, how often is the fourth recorded too?
Each row starts with listings that name the other three studied amenities. The percentage shows how many also name the feature in the row.
| Feature and city | Lists all four | Lists the other three | Also lists this feature |
|---|---|---|---|
| Wi-Fi: Austin | 506 | 507 | 99.8% |
| Wi-Fi: London | 5,371 | 5,456 | 98.4% |
| Wi-Fi: Bangkok | 6,888 | 7,023 | 98.1% |
| Dedicated workspace: Austin | 506 | 762 | 66.4% |
| Dedicated workspace: London | 5,371 | 12,099 | 44.4% |
| Dedicated workspace: Bangkok | 6,888 | 9,176 | 75.1% |
| Kitchen: Austin | 506 | 535 | 94.6% |
| Kitchen: London | 5,371 | 5,503 | 97.6% |
| Kitchen: Bangkok | 6,888 | 7,427 | 92.7% |
| Washer access: Austin | 506 | 689 | 73.4% |
| Washer access: London | 5,371 | 5,879 | 91.4% |
| Washer access: Bangkok | 6,888 | 7,187 | 95.8% |
In Austin, washer access deserves a closer explanation
Austin's distinctive comparison concerned washer access. Among 689 analyzed listings recording Wi-Fi, a dedicated workspace and a kitchen, 506 also recorded washer access: 73.4%. The corresponding shares were 91.4% in London and 95.8% in Bangkok.
Looking at complete combinations gives that difference a useful scale. Wi-Fi, workspace and kitchen without a washer label appeared in 14.4% of all analyzed Austin listings. That same pattern accounted for 3.4% in London and 2.7% in Bangkok.
For an Austin host who offers washer access alongside the other three features, laundry is therefore a detail worth explaining precisely. A photo and caption can answer where the machine is and how guests can use it. “Washer available” alone leaves those questions open.
Our washer category includes access in the unit or building, with free, paid or unspecified terms. It does not mean that every listing has a private machine. A host with a shared laundry room should show and describe shared access, rather than borrow the stronger promise of an in-unit washer.
This concerns an existing feature. The comparison does not establish the profitability of installing a washer or the booking consequences of not listing one.
In Bangkok, show what the common combination looks like
All four amenities were the most common complete combination in Bangkok, appearing in 61.2% of analyzed listings. Another 20.3% recorded Wi-Fi, kitchen and washer access without the dedicated-workspace label.
For a host with all four, that suggests a different writing task from simply announcing a rare combination. Explain the actual arrangement. A work area can be photographed in relation to the rest of the room. A kitchen photo can show the available cooking space. A laundry caption can state whether access is in the apartment or elsewhere in the building.
Those details make the description more specific. They do not establish superiority: the study did not inspect layouts, compare equipment quality or measure performance.
Wi-Fi also deserves factual treatment across all three cities. Its recorded prevalence was high, but a Wi-Fi label is not a speed or reliability test. A host can provide current, verified service details when available. Common availability is not a reason to omit useful information or to promise uninterrupted video calls.
Keep the full combination in view
All 16 patterns remain visible below, including zeros. The patterns account for every analyzed listing in each city; percentages may not sum to exactly 100% because of rounding.
Individual features and the complete combination
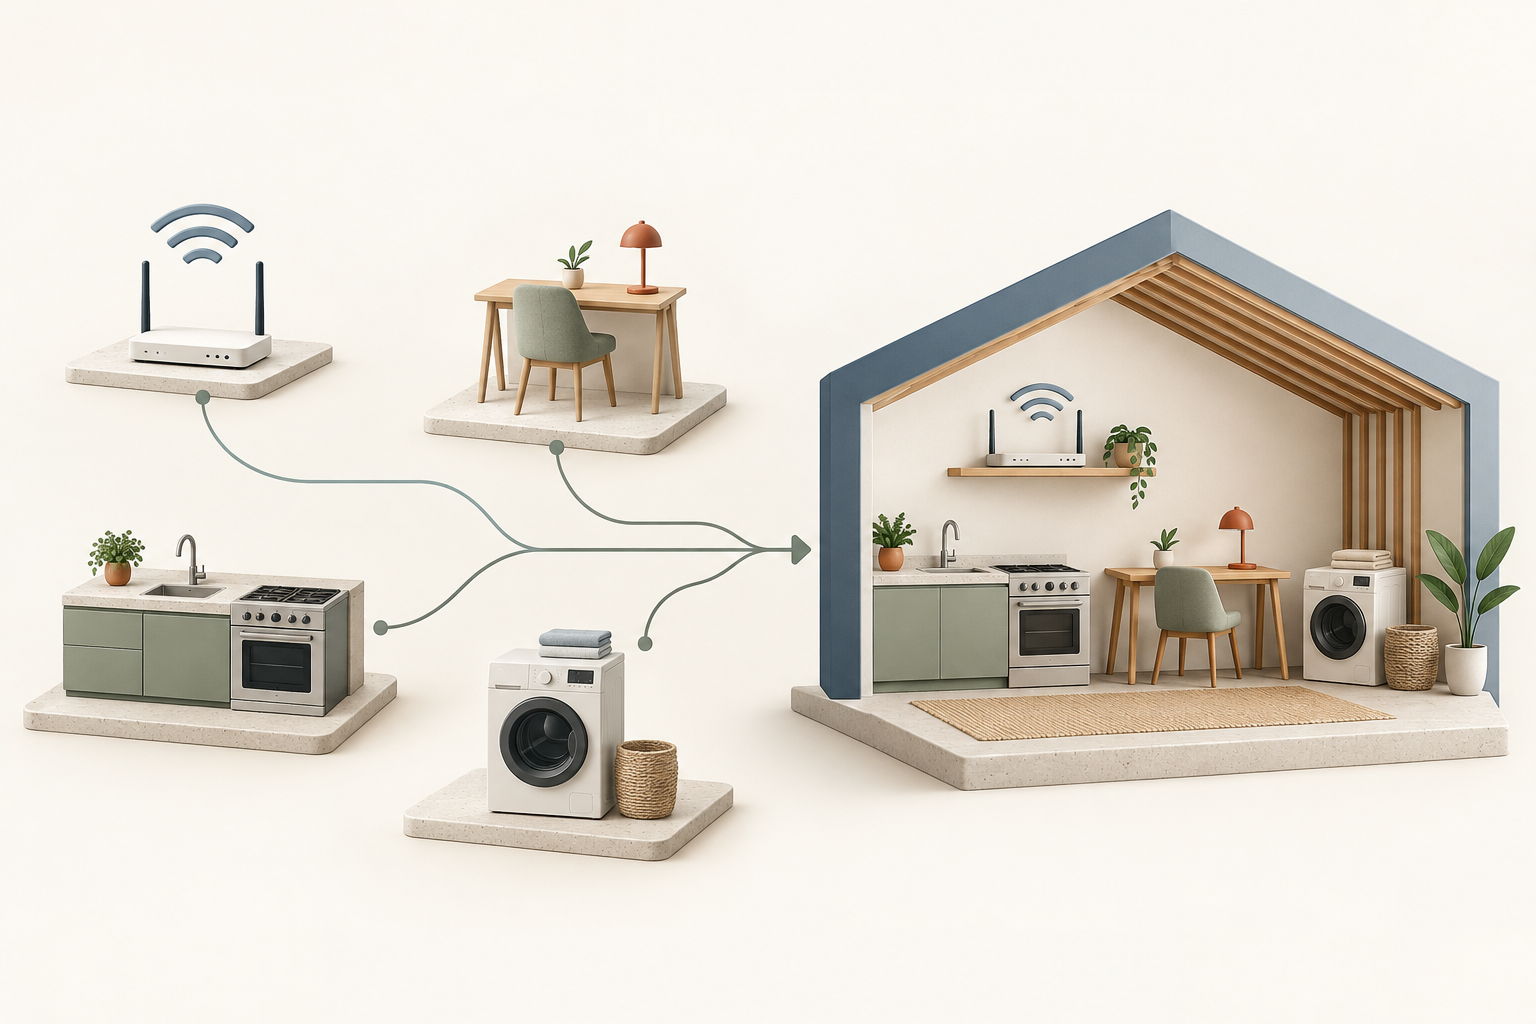
- Four individual amenity categories
- One listing recording all four
Every recorded combination of the four amenities
Every listing with usable amenity data appears in exactly one of these 16 rows.
View all 16 combinations
| Recorded combination | Austin | London | Bangkok |
|---|---|---|---|
| None of these four listed | 0.2% | 0.3% | 0.3% |
| Washer access | 0.0% | 0.1% | 0.2% |
| Kitchen | 0.0% | 0.3% | 0.5% |
| Kitchen and washer access | 0.4% | 1.9% | 1.1% |
| Dedicated workspace | 0.0% | 0.0% | 0.1% |
| Dedicated workspace and washer access | 0.0% | 0.0% | 0.1% |
| Dedicated workspace and kitchen | 0.1% | 0.1% | 0.1% |
| Dedicated workspace, kitchen and washer access | 0.1% | 0.6% | 1.2% |
| Wi-Fi | 5.0% | 2.1% | 1.8% |
| Wi-Fi and washer access | 2.4% | 1.3% | 2.6% |
| Wi-Fi and kitchen | 8.4% | 4.5% | 1.2% |
| Wi-Fi, kitchen and washer access | 20.1% | 44.6% | 20.3% |
| Wi-Fi and dedicated workspace | 7.0% | 4.4% | 2.0% |
| Wi-Fi, dedicated workspace and washer access | 2.3% | 0.9% | 4.8% |
| Wi-Fi, dedicated workspace and kitchen | 14.4% | 3.4% | 2.7% |
| All four listed | 39.7% | 35.6% | 61.2% |
London has a large Wi-Fi–kitchen–washer combination without a workspace label. Austin has more varied combinations, including the three-feature group without recorded washer access. Bangkok more often records all four together. These are different descriptions of captured supply, not a ranking of cities or their hosts.
Three hypothetical photo and caption briefs
These hypothetical examples are not sampled properties. Use their captions only if they accurately describe your place.
For a London one-bedroom apartment with all four features, imagine a desk beside the bedroom window with a desk chair. The photo shows the whole work area. A caption could read: “Desk and chair beside the bedroom window.” It explains a genuine setup without claiming a separate office, exceptional comfort or proven suitability for remote work.
For an Austin place with a washer in a shared building laundry room, photograph that room rather than suggesting that the appliance sits inside the rental. A possible caption is: “Shared laundry room on the ground floor; washing is coin-operated.” Access details do more work here than an unexplained laundry icon.
For a Bangkok apartment recording all four, the brief could use separate photos of the desk, kitchen and in-unit washer. A caption beside the kitchen might say: “Kitchen with a two-burner stovetop beside the dining table.” The point is to make the actual space understandable, without calling a common four-feature combination unique.
The same approach can carry into social posts: one genuine feature, a photograph that shows it and a caption that answers an ordinary question. The related resources below include social media post templates to help structure that copy, a calendar to organize several feature posts, and Instagram image sizes to prepare each image for its intended placement.
Do the main differences survive a narrower comparison?
Yes. The main workspace and washer differences remained when we restricted the analysis to listings whose property type was exactly “Entire rental unit.” That narrower group contained 501 analyzed Austin listings, 11,118 in London and 8,268 in Bangkok.
The main comparisons within entire rental units
The same fourth-amenity comparison, restricted to listings whose property type is exactly “Entire rental unit.” Each row begins with rental-unit listings recording the other three amenities.
View the entire-rental-unit comparison
| Feature and city | Lists all four | Lists the other three | Also lists this feature |
|---|---|---|---|
| Wi-Fi: Austin | 227 | 228 | 99.6% |
| Wi-Fi: London | 3,578 | 3,648 | 98.1% |
| Wi-Fi: Bangkok | 5,000 | 5,107 | 97.9% |
| Dedicated workspace: Austin | 227 | 358 | 63.4% |
| Dedicated workspace: London | 3,578 | 8,876 | 40.3% |
| Dedicated workspace: Bangkok | 5,000 | 6,779 | 73.8% |
| Kitchen: Austin | 227 | 235 | 96.6% |
| Kitchen: London | 3,578 | 3,657 | 97.8% |
| Kitchen: Bangkok | 5,000 | 5,399 | 92.6% |
| Washer access: Austin | 227 | 290 | 78.3% |
| Washer access: London | 3,578 | 3,942 | 90.8% |
| Washer access: Bangkok | 5,000 | 5,211 | 96.0% |
We also repeated the calculations with a stricter Wi-Fi definition, excluding pocket Wi-Fi and a zero-Mbps label unless another qualifying Wi-Fi label was present. The main differences remained. This checks the effect of those labels, not whether the internet worked well.
How we built the comparison
We fixed the cities, property scope, four amenities and comparison rules before calculating the results. The source was Inside Airbnb's September 2026 detailed-listing files. We counted unique listing IDs within each city, without assuming that different IDs always represented different physical homes.[1][2]
The eligibility rules selected records classified as an entire home or apartment, with one bedroom and a maximum capacity of two guests. We did not filter on availability, reviews or bookings, so the analysis should not be read as a count of currently bookable properties.
Amenity lists were parsed using a fixed set of exact labels. “Dedicated workspace” and “Kitchen” required those labels. A kitchenette or outdoor-kitchen label alone did not qualify as Kitchen. Washer access excluded a nearby laundromat or laundry service alone. Wi-Fi labels were grouped without treating advertised speeds as independently verified.[4]
Of the eligible records, one in Austin, 20 in London and 12 in Bangkok had unusable amenity lists. We excluded them from the main percentages and checked extreme alternatives that assigned their unknown features in either direction. Each city's affected share was below 0.14%. The resulting ranges are missing-information bounds, not statistical confidence intervals.
Which listings entered the comparison?
We applied the same property, bedroom and maximum-capacity filters in all three files.
| City | Eligible listings | Usable amenity lists | Unknown amenity lists |
|---|---|---|---|
| Austin | 1,274 | 1,273 | 1 |
| London | 15,106 | 15,086 | 20 |
| Bangkok | 11,269 | 11,257 | 12 |
The files contained blank discovery-source values and “previous scrape” values, with no other populated source label. The data do not support comparing different known discovery sources. The separate Wi-Fi and property-type checks do not remove that coverage limitation.
These three cities were chosen deliberately, not sampled to represent countries or the world. Capture dates were close but not identical. We report counts and descriptive percentages without survey weights, significance tests or a pooled three-city benchmark. The practical use is local context for an accurately described property, not a forecast of guest response.
- Download the amenity combinations, counts and sensitivity tables (CSV)
- Download the analysis code, methods and reproduction instructions (ZIP; English instructions)
The English CSV contains aggregate results for every city and analysis version. The ZIP includes the methods, feature definitions, code and source-file hashes. It does not republish raw listing records, listing identifiers, photographs or descriptions.
Sources and notes
- Inside Airbnb: Get the Data. Detailed-listing batches dated September 17, 2026 for Austin and London, and September 22 for Bangkok. The article uses the records’ actual capture-date ranges. Inside Airbnb publishes the data under CC BY 4.0; Influence IQ performed the analysis.
- Inside Airbnb Data Dictionary. Definitions of listing fields and amenity-list structure. The analysis used the visible v4.3 detailed-listings dictionary and documented its feature mappings separately.
- Airbnb: The amenities guests want, August 31, 2026. Airbnb’s guidance discusses accurate amenity information and photos, alongside its own worldwide search context. That platform guidance is separate from the city-level listing analysis here.
- Influence IQ analysis package and localized results CSV. The package contains aggregate results, analysis code, feature definitions, source-file hashes and the methodology. Raw listing records, identifiers, photographs and descriptions are not republished.
Every language edition presents the same September 2026 analysis of Austin, London and Bangkok. These city comparisons are not national estimates for readers’ markets.