About half of Brazil’s online advertisers say they don’t use CRM
We looked at how Brazil’s online advertisers report using CRM. The findings prompt a practical check of who handles an inquiry, where it is recorded & what happens next.
Original analysis of the official TIC Empresas 2025 released data. Brazil, formal private enterprises with at least 10 persons working in them.
Abstract
Among Brazilian enterprises that reported paying for Internet advertising, an estimated 49.1% explicitly reported no CRM application use in the preceding 12 months. Another 46.2% reported use & 4.7% did not know or did not answer. The 95% interval for the no response was 45.2%–52.9%, making “about half” the appropriate summary.
CRM use was higher among advertisers than among explicit nonadvertisers, but this association does not show that software improves advertising results. The study used the official TIC Empresas 2025 release, covering formal private enterprises with at least 10 persons working in them; interviews ran from February 2025 through January 2026. It is not evidence about solo creators or US businesses. A spreadsheet may be a valid workflow. For business teams, the practical implication is to check who takes responsibility for an inquiry & what they should do next, then decide whether their existing tools need to change.
An advertising campaign can be easy to see. There is a creative, a destination & a budget. The work that follows a response is often less visible: someone needs to understand the question, keep the useful information & decide what happens next.
We compared reported CRM use among businesses that buy online ads & those that explicitly said they do not. Among online advertisers in Brazil’s TIC Empresas 2025 survey, about half explicitly said they had not used a customer relationship management application, or CRM, in the preceding 12 months. That answer gives us a starting point for discussing customer-information work. It does not tell us whether a business had a good process, a bad process or no process at all.
The practical question is therefore one your team can answer: when an inquiry arrives, can the next person see what needs to happen?
Advertising & follow-up are separate jobs
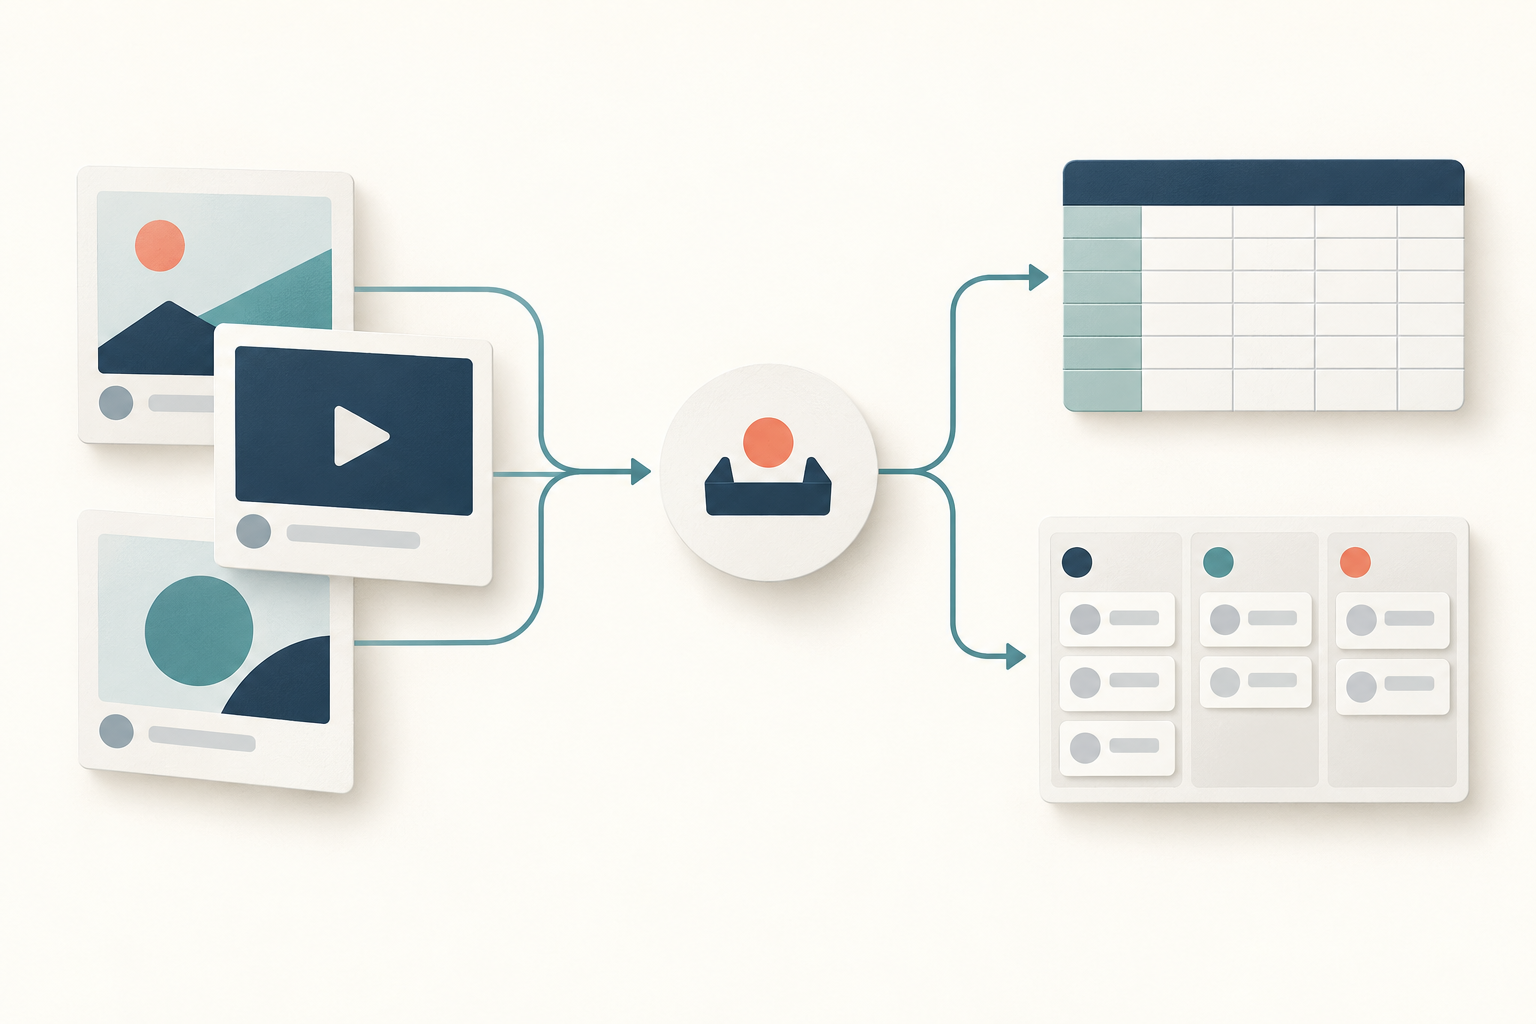
Buying attention leaves another task to organize
The striking part of the result is how evenly the two clear answers divide. An estimated 49.1% of online advertisers explicitly reported no CRM use, while 46.2% reported use. The remaining 4.7% did not know or did not answer the CRM question. Keeping that third group visible matters: uncertainty about a response is different from a clear no.
The figures are weighted estimates for the survey’s covered businesses, rather than simple percentages of the people interviewed. The advertiser group contains 1,710 released enterprise records. Those records contribute differently to the estimates because the survey weights account for its design & adjustments. The result therefore does not mean that 49.1% of 1,710 questionnaire rows were marked no.[2][3]
There is also sampling uncertainty. The 95% interval for the explicit no response runs from 45.2% to 52.9%; for reported use, it runs from 42.3% to 50.2%. “About half” is an appropriate summary. The figures describe a near split, with uncertainty around both shares.[4]
For a business owner, the useful question is what happens between an inquiry arriving & someone agreeing to handle it. An advertising budget buys a chance to be considered. It does not specify which person should reply, where a useful detail belongs or when the next step should happen. Those are decisions the business still needs to make.
About half of online advertisers explicitly reported no CRM use
All three CRM responses remain in the advertiser denominator. The chart shows the weighted shares; the table also shows their 95% intervals.
| CRM response | Weighted share | 95% interval: lower | 95% interval: upper |
|---|---|---|---|
| Reported CRM use | 46.2% | 42.3% | 50.2% |
| Explicitly reported no CRM use | 49.1% | 45.2% | 52.9% |
| Did not know or did not answer | 4.7% | 3.2% | 6.3% |
The comparison businesses tell a different story
Among Internet-using businesses that explicitly said they did not pay for online advertising, estimated CRM use was 19.7%, with a 95% interval of 17.1% to 22.4%. In that same group, 77.3% explicitly reported no CRM use & 3.0% had an unresolved CRM response. All three answers remain part of the denominator. This comparison group contains 2,153 released enterprise records.
The difference in reported CRM use between advertisers & explicit nonadvertisers was 26.5 percentage points. Its 95% interval was 21.6 to 31.4 percentage points. Percentage points describe the distance between two shares, here 46.2% & 19.7%; they do not describe an increase in revenue or a change experienced by an individual business.[4]
These are different businesses observed in the survey, not businesses randomly assigned to advertise. They may differ in size, industry, resources, customer relationships or many other ways. The analysis does not show whether advertising encouraged CRM use, CRM use encouraged advertising, or other circumstances contributed to both.[7]
It is tempting to treat the contrast as a software recommendation. A more useful reading is that advertising & customer-information work often coexist, while many advertisers still report no CRM application. For your own team, that is a reason to examine the handoff. It is not evidence that buying a tool will improve ad performance, or that every business should adopt the same process.
CRM use was less common among explicit nonadvertisers
This group contains Internet-using enterprises that explicitly said they had not paid for Internet advertising. Unresolved CRM responses remain in the denominator.
| CRM response | Weighted share | 95% interval: lower | 95% interval: upper |
|---|---|---|---|
| Reported CRM use | 19.7% | 17.1% | 22.4% |
| Explicitly reported no CRM use | 77.3% | 74.7% | 80.0% |
| Did not know or did not answer | 3.0% | 1.7% | 4.2% |
The use-share difference was 26.5 percentage points
The estimated difference compares reported CRM use in the two business groups. It is an association, not a measured effect of advertising or CRM.
| Comparison | Difference | 95% interval: lower | 95% interval: upper |
|---|---|---|---|
| Advertiser share minus explicit nonadvertiser share | 26.5 percentage points | 21.6 percentage points | 31.4 percentage points |
Check how customer information is used
The survey asked whether the business had used an application to manage customer information, also called CRM, during the previous 12 months. It did not inspect the company’s files, watch a sales team work or test whether an inquiry received a reply. A no answer cannot establish that the company keeps no customer records.[2]
Removing the unresolved CRM answers would answer a different question: the balance among businesses whose respondent gave a clear yes or no. It would no longer describe the full advertiser group. We retained those answers in the published shares so that a reader can see how much information is unresolved, without treating uncertainty as either adoption or nonuse.
A shared spreadsheet may be a reasonable way for a small team to coordinate a manageable set of inquiries. Another business may need an application because several people work on the same accounts, responsibilities change frequently or access needs to be controlled more closely. These are practical choices to assess locally. Neither arrangement was rated for quality in this study.
The reverse distinction matters too. Reporting CRM use does not tell us whether the information is current, whether staff consult it or whether it connects with the advertising account. A business can have software & still leave a conversation without an owner. The survey does not measure that situation, but it is a useful possibility to check when reviewing your own process.
Start with the work your team needs to do. Can someone find the inquiry, understand what the person asked, see who is responsible & identify the next action? Answering those questions can reveal a concrete change to make. It also prevents a conversation about software categories from replacing a conversation about how work actually moves through the team.
Follow one inquiry before choosing a new tool
Choose a recent inquiry that your team can review appropriately. Follow it from the advertising response or contact channel to the next business action. You are checking your own workflow, rather than trying to recreate the survey or classify your business from one example.
First, establish where the inquiry arrives. It might reach a website form, an inbox or a conversation on a social platform. Record enough context to recognize the request later, including the campaign or source when it is actually known. If the source is unclear, leave it unclear rather than giving an advertisement credit because it happened to be running.
Next, look for an agreed place to keep useful information. The record should help the next person act without searching through unrelated messages. A short summary of the question, the latest response & a link to the appropriate working context may be more useful than copying an entire conversation into another system. Keep access & the information retained consistent with the business’s own requirements.
Then identify responsibility. A visible name or team role makes a handoff easier to understand than a note saying “sales to follow up.” Finally, state an action & a suitable review time. “Send the requested delivery information tomorrow” gives the next person something concrete to do. A date alone does not explain the job.
The four steps below are a practical checklist. They are not a process measured by TIC Empresas, & the illustration does not represent surveyed businesses or measured frequencies.
Give the next person enough to act

Identify the inquiry
Find where the request arrived & preserve its useful context.
Make a usable record
Keep the details needed for the next task in an agreed place.
Name an owner
Identify who is responsible for moving the request forward.
Agree the next action
State what should happen & when the team should review it.
A fictional week at a small wholesaler
Consider a fictional Brazilian wholesaler with 12 people working in the business. It promotes products online & receives 20 inquiries during an example week. The marketing coordinator sees the advertising activity, while a sales coordinator handles product questions. The business currently uses a shared worksheet. Every detail in this example is illustrative; it is not a survey record or a measured result.[8]
One inquiry asks whether a particular product can be delivered before an event. The marketing coordinator adds an entry labeled E01, notes the requested timing & assigns the sales coordinator to check availability. The next action is to reply after the stock check. The worksheet links to the original conversation so the coordinator can see the wording if needed.
A second inquiry concerns a different product & has no reliable campaign identifier. Its source remains “unknown.” That avoids turning the worksheet into an invented attribution report. A third customer has already received the requested information; the record says what was sent & whether another action was agreed. The team does not assign the same status to every person who has contacted it.
At the review, the owner asks whether each active entry has a responsible person & a next action. If the team can answer consistently using its worksheet, the immediate improvement may be a clearer routine rather than new software. If entries are repeatedly hard to find or two people cannot tell who should act, the owner can investigate that specific difficulty & consider a tool that addresses it.
Nothing in the example establishes that all 20 inquiries require the same treatment, that a sale will result or that CRM would change the outcome. Its purpose is to make the handoff visible. The survey finding supplies a reason to ask about that handoff; the fictional case shows one way a team could examine it.
A follow-up record you can copy
Use the fields below in an existing worksheet, a CRM application or another agreed place. They are available here without a sign-up. Keep the form short enough that the people responsible will maintain it, & add detail only when it changes the next useful action.
Inquiry reference: give the request a short identifier that the team can recognize.
Received: note when it arrived & which contact channel received it.
Source: record the campaign or other source if known. Use “unknown” when the evidence is missing.
Request: summarize what the person wants & any timing they have supplied.
Owner: name the person or role responsible for the next action.
Current position: state what has actually happened, such as “availability being checked” or “requested information sent.”
Next action: describe the task, who will perform it & when it should be reviewed.
Working context: link to the appropriate conversation or file, with access suitable for the team.
Closure: note the outcome that is actually known, or why there is no further agreed action.
For the fictional E01 inquiry, the entry could read: “Delivery timing requested; sales coordinator checking stock; reply after the check tomorrow; source unknown.” That is useful even without a prediction about whether the customer will buy. Do not turn “information sent” into “sale completed,” or an unknown source into an attributed advertising result.
Agree which statuses the team will use & what they mean. Check one completed handoff together before expanding the form. If a field is routinely left blank, find out whether it is unnecessary, difficult to establish or missing a responsible person. Adding more columns does not by itself resolve any of those problems.
How to read these CRM statistics
These findings come from the official TIC Empresas 2025 release, produced by Cetic.br/NIC.br. The covered population consists of active formal private Brazilian enterprises with at least 10 persons working in them, in the survey’s covered industries. The enterprise is the unit, even when it has several locations. The findings are not estimates for US businesses, informal firms, businesses with 1–9 people or solo creators.[1]
The survey’s interviews took place from February 2025 through January 2026. Questions concerned the preceding 12 months for each interview, rather than one identical calendar period for every respondent. Paid Internet advertising included search, social networks & other websites. There is no Meta-only measure in this comparison.
We analyzed the exact 4,171 released records. Of these, 4,150 reported Internet use. The two comparison groups were the 1,710 enterprises reporting paid Internet advertising & 2,153 reporting none. Another 282 did not know whether the business paid for advertising & 5 did not answer that question; they were outside this contrast. The 21 other records were outside the Internet-user question group. The producer reports 4,174 completed interviews; the reviewed sources do not explain the three-record difference.[3]
The reported response rate was 8%. That is about participation in the survey, not the share answering the CRM question. The released data have undergone statistical confidentiality treatment. Weighting & the supplied uncertainty calculations do not remove every possible effect of that treatment, nonresponse, reporting or coverage.[1][4]
We also retained a small benchmark mismatch & an unresolved year label in the source workbooks. The methods download explains the change to our criteria for using the source, made before these CRM comparisons, preserves the original failed check & provides the exact comparisons. It does not claim that every strict benchmark passed or explain the mismatch as rounding.[5][6]
Choose the next change from your own evidence
The study supports a narrower, more useful discussion than “advertisers need CRM.” About half of the covered advertisers explicitly reported no CRM application, while reported use was much more common among advertisers than among explicit nonadvertisers. That combination is worth investigating in a business. It does not choose the right system for that business.
If your team already has a workable shared record, check whether responsibilities & next actions are clear before adding another tool. If the difficulty is access, search, repeated handoffs or a growing number of related conversations, describe that difficulty plainly. Compare possible solutions against the work that needs to happen, including the option of improving the existing arrangement.
Keep the advertising review connected to that conversation without inventing a performance claim. Our social media campaign template can help set out what a campaign is trying to achieve. The social media audit template can help review the surrounding account workflow. The ROI calculator is a separate aid for explicit cost & return assumptions; this survey supplies no return estimate to enter into it.[9]
A useful next step is one real inquiry that the team can trace from arrival to an agreed action. What you learn from that review belongs to your business. The Brazil survey provides context & a question to ask, while the answer about your next operating change needs evidence from your own work.
No sign-up required. The ZIP includes aggregate data, reproducible analysis code, follow-up templates & methods. It retains the original strict check, the later change to the criteria for accepting the source, the unresolved numerical difference & the workbook year-label conflict. No enterprise-level respondent records are included. To reproduce the estimates, obtain the official source release separately.
Sources & notes
- Cetic.br/NIC.br, TIC Empresas 2025. The frame covers active formal private Brazilian enterprises with at least 10 persons occupied in the covered industries. Persons occupied is broader than payroll employees. Fieldwork ran from February 2025 through January 2026 in three waves; questions refer to each interview’s preceding 12 months. The producer reports 4,174 interviews & an 8% response rate. Released records have undergone statistical confidentiality treatment; the reported intervals do not cover every possible nonresponse, coverage, reporting or confidentiality-treatment effect.
- The released dictionary defines B1 as Internet use, B17A as paying for Internet advertising, & A6 as using an application to manage customer information, also called CRM. Questions refer to the preceding 12 months. Internet advertising includes search, social networks & other websites. B17A is asked within the Internet-use group; A6 is asked more broadly. These are self-reported enterprise responses, not observations of lead handling, software integration, advertising spend or performance.
- Analysis uses the exact 4,171 released enterprises, not the 4,174 interviews reported by the producer; the three-record difference is unexplained in the reviewed sources. There are 4,150 Internet-use records: 1,710 explicit advertising users, 2,153 explicit nonusers, 282 do-not-know responses & 5 no-answer responses. The other 21 records are outside the Internet-use question group. CRM use/no/unresolved shares use each entire advertising group as denominator. Advertiser CRM response counts are 942/691/77; explicit nonadvertiser counts are 532/1,568/53. Percentages use survey weights, not these raw count ratios.
- Influence IQ calculated weighted shares using the supplied full weights & 200 combined bootstrap replicate weights with their native variance settings. The 95% intervals use the normal approximation. The use-share contrast is advertiser minus explicit nonadvertiser, calculated within each common replicate so the supplied covariance is retained. Intervals describe the supplied sampling-design variance for the confidentiality-treated released data. Matching national totals does not show that this new advertising-by-CRM comparison would be the same before confidentiality treatment. The downloads retain full precision, group flows & classification bounds; classification bounds are not confidence intervals.
- The initial national benchmark check passed 15 of 16 comparisons at its unchanged tolerance of 0.0000500001 percentage points: 7 of 8 stored point estimates & all 8 uncertainty margins. The remaining absolute point difference was about 0.00005243 percentage points; its producer-side cause remains unresolved & is not attributed to rounding. After this check, but before calculating the conditional CRM comparisons, we changed the criteria for accepting the released source, based on verified release/design integrity, independent arithmetic, the margin checks & producer reporting evidence. National marginals & the discrepancy were already known. The original failed flag & all 16 comparisons remain in the public method package. This was not a blinded or publicly preregistered study, & the amendment did not turn the original strict check into a pass.
- Included benchmark workbooks contain citation footers naming 2024. The official 2025 microdata release, current 2025 indicator tables & producer press release identify the edition used here. The current software-use table reports CRM for 2025, & the release describes fieldwork through January 2026. The footer conflict’s cause is unresolved; we do not claim that the producer corrected it. The methods package retains this conflict & the exact source references.
- This is a descriptive association in the released survey data. Advertising was not randomly assigned, & the analysis establishes neither the order of adoption nor the effect of CRM on sales, lead loss, response quality, advertising return or customer outcomes. Explicit no CRM use does not mean no customer records. Reported CRM use does not establish an effective workflow.
- The wholesaler, its 12-person size, 20 inquiries, E01 record & operating choices are fictional examples. The follow-up record & four-step checklist are practical suggestions, not measured survey workflows, a software recommendation or a promise of improved performance.
- The campaign template, audit template & ROI calculator are existing related resources. They do not supply or validate the survey estimates. Any costs, returns or operating assumptions entered into a separate business review need their own evidence.
All language versions are translated directly from the English article. Every edition describes the same Brazilian survey population, definitions & calculations; translation does not create evidence for another country. Influence IQ is responsible for this analysis, interpretation & translation.